Launch Watch · Spaceflight
Published
Apollo’s surface stays grew 3.47-fold. EVA time grew 8.73-fold.
Compare all six Apollo lunar landings using actual landing and ascent clocks and cabin-depressurization EVA intervals, with a downloadable six-mission table.
Apollo 17 stayed on the Moon for just under 75 hours, compared with about 21.61 hours for Apollo 11. Its recorded surface EVA intervals totaled 22.07 hours, compared with 2.53 hours for Apollo 11. Across those endpoints, the stay grew 3.47-fold while surface EVA time grew 8.73-fold.
Those ratios become useful only when both clocks are defined. We joined the actual landing and ascent event tables in NASA’s Apollo by the Numbers to its separate EVA table, then calculated the same measures for all six successful landings.
What goes into each clock?
Surface stay runs from the lunar module’s landing event to its ascent event. Both timestamps are ground elapsed time, or GET, on the mission clock. Subtracting them avoids mixing a Florida local time with a GMT time of day.
Surface EVA time uses the report’s cabin-depressurization-to-pressurization intervals for its lunar surface EVAs. These intervals include the transition between the cabin and the surface. They are mission-level elapsed durations, not a separate stopwatch for each astronaut’s feet on the ground.
We exclude Apollo 15’s separately listed stand-up EVA and the separately listed transearth EVAs. Summing two astronauts’ individual time would create astronaut-hours, a different measure. The comparison below never does that.
| Mission | Landing–ascent (h) | Surface EVA (h) | EVA / stay (%) |
|---|---|---|---|
| Apollo 11 | 21.61 | 2.53 | 11.70 |
| Apollo 12 | 31.52 | 7.76 | 24.60 |
| Apollo 14 | 33.51 | 9.38 | 27.98 |
| Apollo 15 | 66.91 | 18.58 | 27.77 |
| Apollo 16 | 71.04 | 20.24 | 28.49 |
| Apollo 17 | 74.99 | 22.07 | 29.42 |
Values are rounded to two decimal places for reading; the download retains the underlying seconds and event strings. The fractions are calculated before rounding.
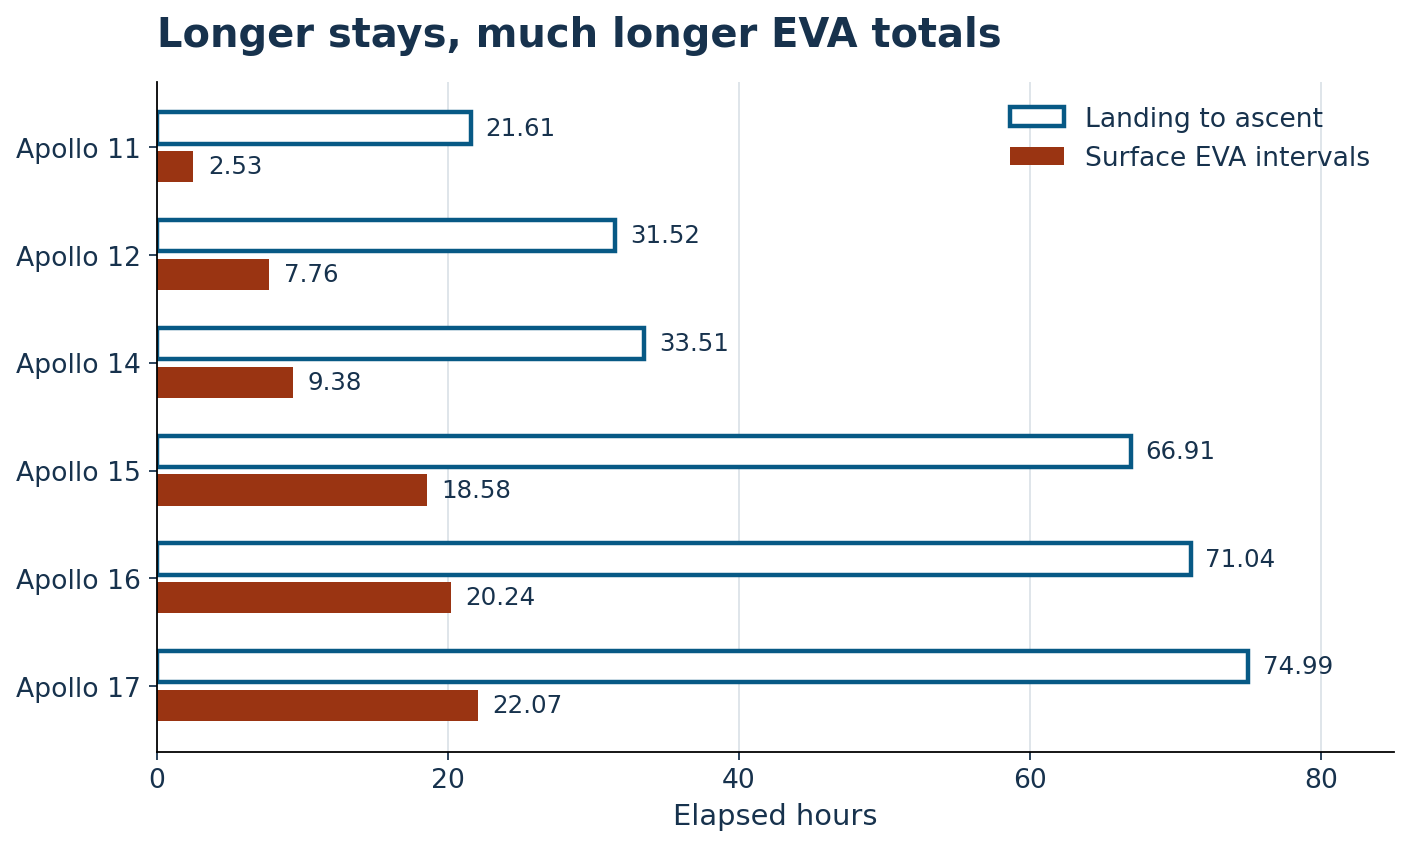
The EVA fraction rose, with a small exception
Apollo 11’s EVA interval occupied 11.70% of its surface stay. Apollo 17’s occupied 29.42%. This accounts for why the EVA-time increase is much larger than the stay-time increase: the later endpoint had a longer visit and a larger fraction of that visit within the selected EVA intervals.
The fraction does not rise at every step. Apollo 14 reaches 27.98%, while Apollo 15 reaches 27.77%. Apollo 15’s EVA total was much longer, but so was its surface stay. A chart of total EVA hours alone would not show that small decline in the ratio.
This is a time-allocation comparison. The remainder includes all time outside the selected intervals; we do not assign it to sleep, preparations, experiments or other activities without a separate activity timeline. Likewise, the percentage does not measure scientific productivity or crew efficiency.
Recheck Apollo 15 in three operations
The printed landing table gives Apollo 15’s GET as 104:42:31.1. Its ascent GET is 171:37:23.2. Subtraction yields 66 hours, 54 minutes and 52.1 seconds, or 66.91447 hours.
The three listed surface EVA durations are 06:32:42, 07:12:14 and 04:49:50. Their sum is 18:34:46, or 18.57944 hours. Divide that total by 66.91447 and multiply by 100: the result is 27.77%.
This worked example also explains why source images matter during transcription. A single misread digit in a mission-event table changes the denominator. We visually checked the landing, ascent and EVA pages, including the Apollo 15 landing entry, before doing the arithmetic.
Download and method
The six-mission CSV contains each landing GET, ascent GET, surface-stay seconds, EVA-interval seconds, hours and percentage. To reproduce the calculation, convert every GET to total seconds, subtract landing from ascent, and divide the summed surface EVA seconds by the result.
These are recorded mission events, not preflight plans. The comparison covers Apollo 11, 12, 14, 15, 16 and 17. No interpolated “Apollo 13” point has been inserted. Source timestamps have differing displayed precision, so the extra decimal places retained for arithmetic should not be treated as a uniform measurement-accuracy claim.
For another example of keeping Apollo quantities attached to their definitions, read our Apollo 11 fuel-margin analysis. Here, the decisive distinction is between the complete stay and the specific EVA intervals counted inside it.
Source and chart credit
Apollo by the Numbers, NASA SP-2000-4029: printed p. 294, “LM Lunar Landing”; p. 297, “LM Ascent and Ascent Stage Lunar Impact”; p. 298, “Extravehicular Activity,” including footnote 42. These are PDF pages 304, 307 and 308.
Chart and calculations: LaunchDetect, from the cited numerical records. Source PDF page images were used for transcription checks and are not republished here. No NASA endorsement is implied.