Space above us.
The ocean below.
Read the launch record. Follow the people in orbit. Explore how the paths to space connect with the world we share.
Open the live globe →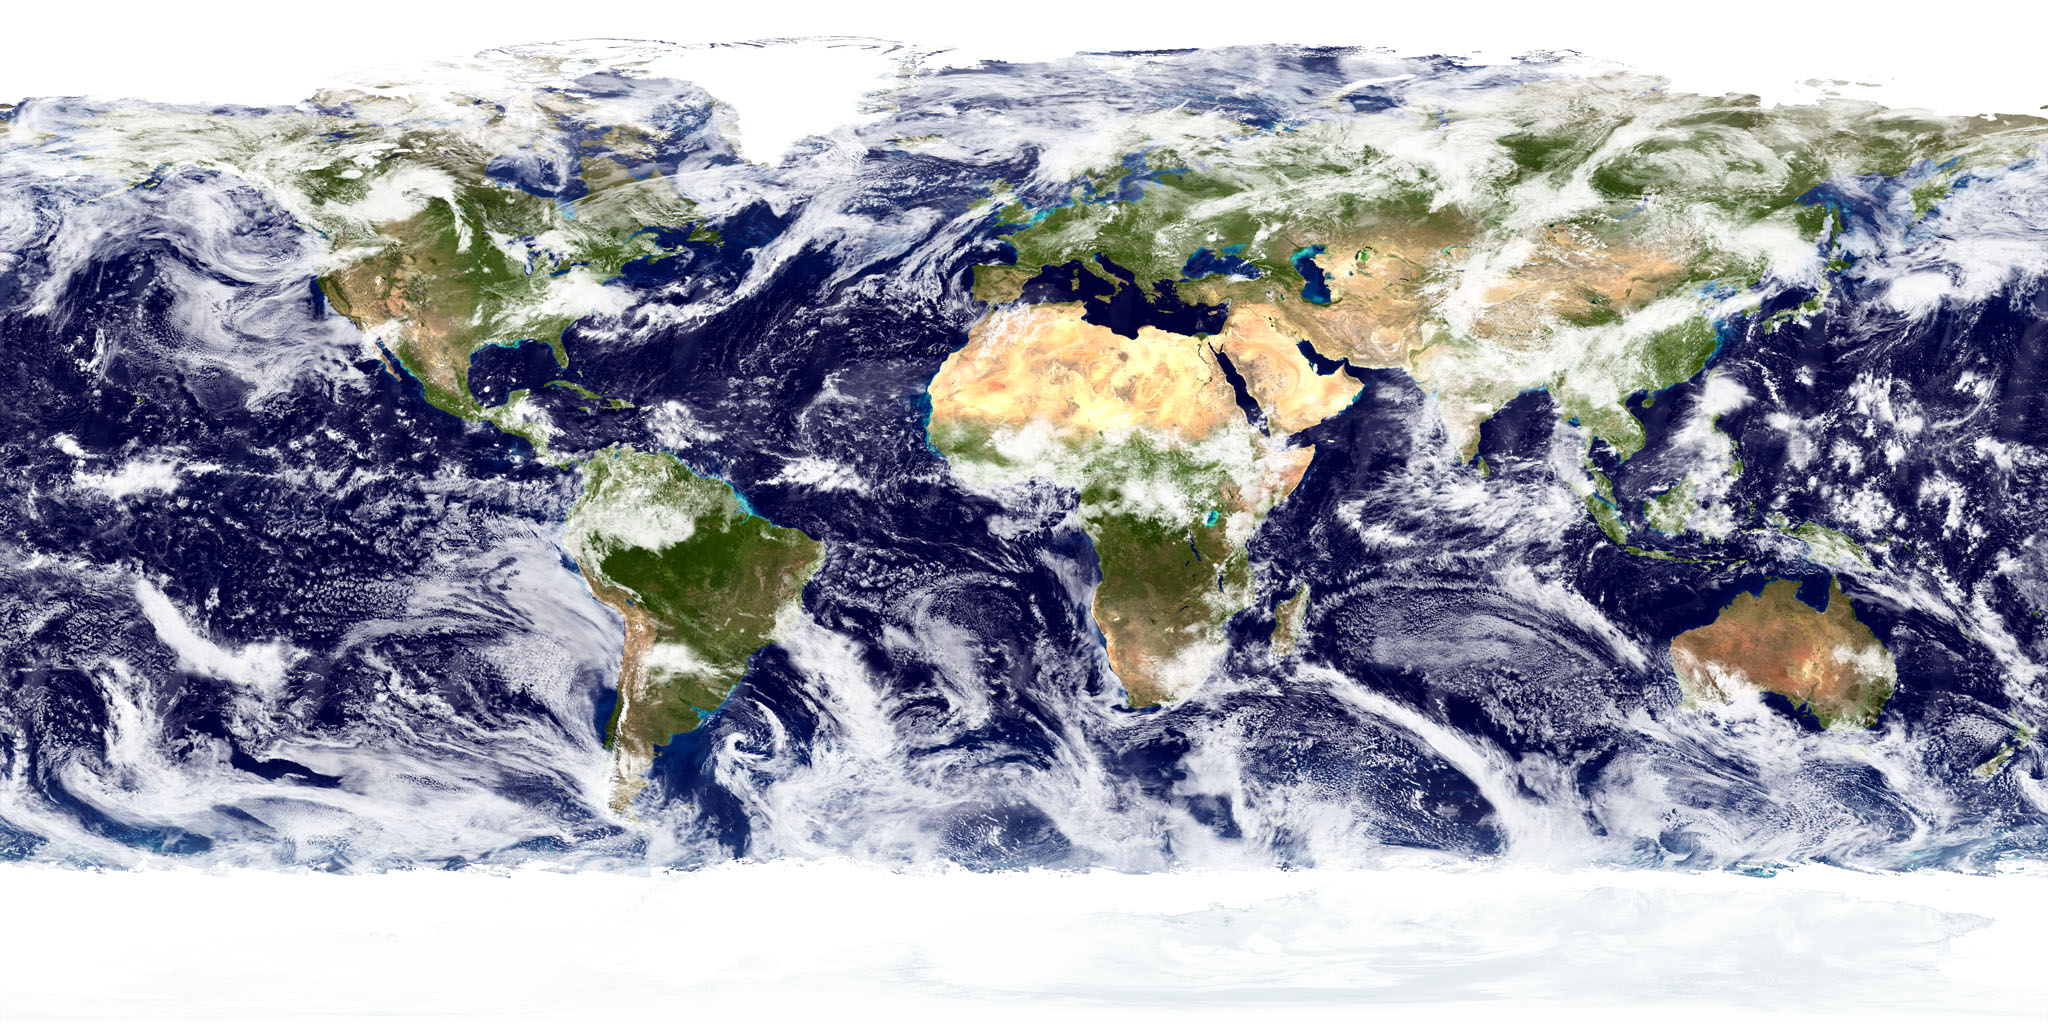
Field notes
Guides to the public mapThe closest Moon of 2024 was almost new
An audit of 8,784 hourly Moon samples separates distance, apparent size and phase, with proportional outlines and a downloadable data table.
Read articleApollo’s surface stays grew 3.47-fold. EVA time grew 8.73-fold.
Compare all six Apollo lunar landings using actual landing and ascent clocks and cabin-depressurization EVA intervals, with a downloadable six-mission table.
Read article2,815 exoplanet masses came from a mass–radius relationship
Audit a 5,844-planet archive extract: provenance labels, calculated values and blank fields reveal why a filled mass column needs more than a number.
Read articleWebb’s 2024 path stayed 307,000 to 799,000 km off the Sun–Earth line
Project reconstructed Webb and Sun vectors onto a shared axis to measure sideways distance, with 367 daily samples and clear limits on what the geometry shows.
Read articleMars’s 2023 command-pause plan was about solar interference, not a light-time spike
Compare NASA’s November 2023 Mars command plan with 721 hourly ephemeris samples: sky separation narrowed while one-way light time changed by only 20.72 seconds.
Read articleSaturn’s two 2025 crossings: Earth on March 23, the Sun on May 6
Separate viewing geometry from illumination using 4,345 hourly Saturn samples, with two zero-crossing brackets and a downloadable model-data table.
Read articleTwelve minutes near Arrokoth changed LORRI’s native image scale by about 2.5 times
Use two documented New Horizons ranges and LORRI’s nominal angular sampling to calculate about 83 and 33 meters per native pixel, without confusing pixels with resolved detail.
Read articleK2’s final campaign had three different data windows
Match Campaign 19 calibrated pixels, SAP and PDC processing windows to a real 740-row target file, including 385 zero-filled corrected-flux rows outside the PDC interval.
Read articleThe widest eclipse path and longest totality belong to different eclipses
A 67-eclipse catalogue audit separates path width from central duration: the 2033 widest-path prediction is 781 km but 2m37s, while 2009 reaches 6m39s.
Read article2023 vs. 2024 ozone-hole duration: 113 days versus 76
Compare 153 daily ozone-hole areas in each year. Reproduce two threshold counts, peak dates and the limits of a size-versus-duration comparison.
Read articleGreenland’s 2019 mass rebound: what 76 gigatons restored
Reproduce a 622-gigaton decline and 76-gigaton rebound in Greenland’s monthly gravity-derived mass record, with source bounds and careful date labels.
Read articleBondville’s 2024 eclipse: sunlight fell, infrared persisted
Inspect 240 one-minute SURFRAD rows from the April 2024 eclipse. Reconstruct shortwave irradiance and compare it with downward thermal infrared.
Read articleHilo and Honolulu solar data: similar years, different peaks
Compare 2024 NASA POWER monthly grid-cell estimates, all-sky versus clear-sky ratios and day-weighted energy totals for two Hawaii coordinates.
Read articleFour NOAA CO₂ stations: why August 2020 changed the order
Compare 48 monthly surface-flask CO₂ values from Utqiaġvik, Mauna Loa, American Samoa and South Pole, with a downloadable same-product dataset.
Read articleOne Bondville pixel, two different vegetation seasons
Compare 2012 and 2013 MODIS NDVI at one fixed pixel, with quality gaps, selected-observation dates and a reproducible 36-composite download.
Read articlePhoenix at night: what a MODIS surface pixel measured
Inspect 20 day/night surface-temperature composites from 2023, with local-solar sampling times, decoded quality flags and limits on air-temperature claims.
Read articleSioux Falls snow-week sunlight: 23% versus 75% reflected
Reconstruct two three-hour radiation windows around January 2024 snowfall, and calculate reflected-energy fractions from 360 quality-checked minutes.
Read articleIdalia week: track the same 284 Gulf temperature cells
Reproduce a fixed-grid daily OISST comparison across August–September 2023, with area weights, cell-level differences and limits on storm attribution.
Read articleWhy the biggest temperature anomaly gets a smaller weight
Reconstruct the 2023 GISTEMP global anomaly from eight latitude bands. Compare area-weighted terms with an unweighted mean and inspect the exact fractions.
Read articleCrew-12’s undocking target shifted seven hours. Here are both clocks.
Compare NASA’s October 3 and October 5 Crew-12 undocking targets in EDT, UTC and Hawaii time, with handover and splashdown kept distinct.
Read articleNASA’s Madagascar photo: the viewing angle behind the bright rocks
An original calculation from NASA’s astronaut-photo metadata places the scene about 56 degrees off nadir, with clear limits on measuring the image.
Read articleGLODAP’s 1,181 cruise rows: the uncertainty that averaging keeps
Audit GLODAPv3’s cruise uncertainty file and see why a shared 2.1 µmol/kg component cannot be divided by the square root of a bottle count.
Read articleCuriosity’s Basque Lakes images: two products, two kinds of clock
Two MAHLI records share Sol 5023 but record a focus merge and an exposure. An original metadata audit explains their times, focus counts and limits.
Read articleThree hours, 37 or 19 frames: auditing LaunchDetect’s thermal replays
Audit 93 published LaunchDetect frames across three launches. Compare actual replay spacing, inclusive counts and the nine frames without plotted score points.
Read articleLooking for a specific launch?
The public map links each launch to its published evidence record.
Periodic launch briefings
Weekly launch outlooks and monthly activity reviews from LaunchDetect.
Register for briefings
Email confirmation required before distribution.