Space above us.
The ocean below.
Read the launch record. Follow the people in orbit. Explore how the paths to space connect with the world we share.
Open the live globe →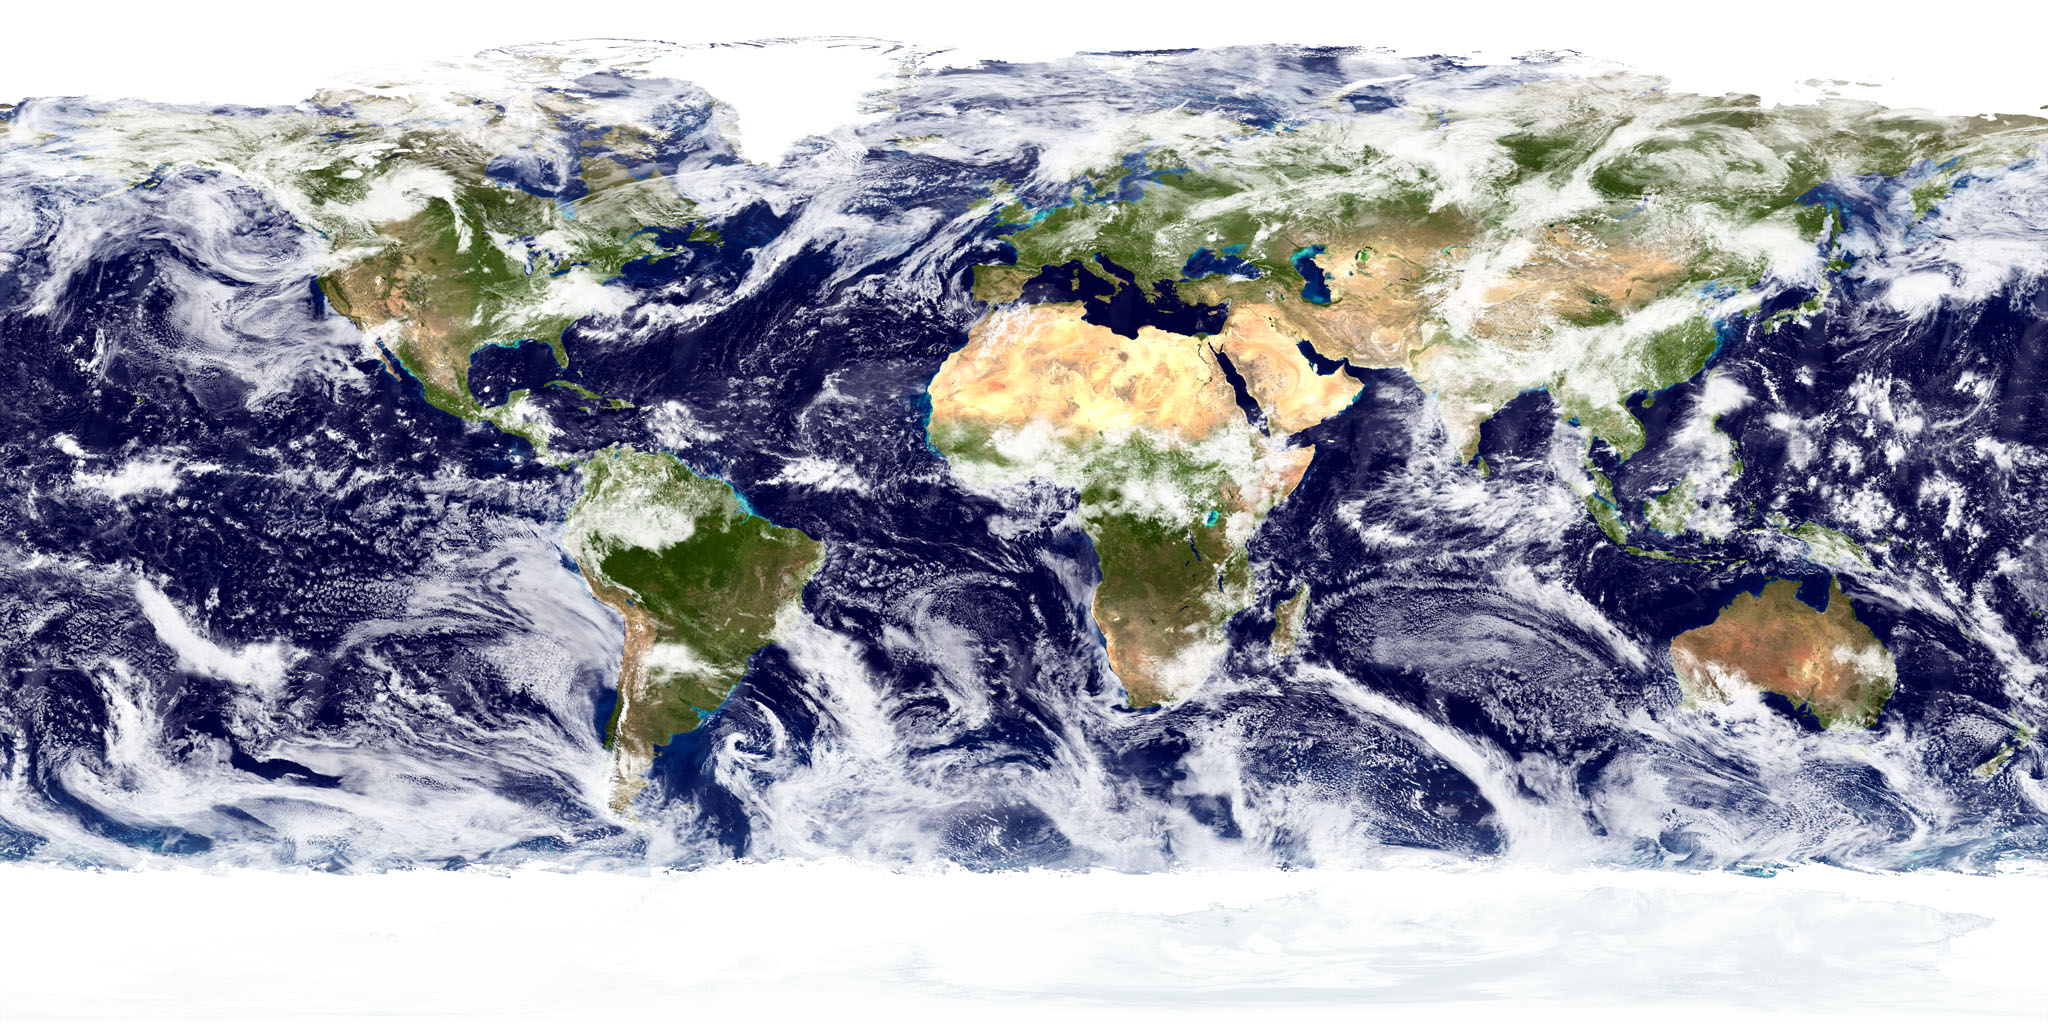
Field notes
Guides to the public mapTransporter 18 imagery before detection publication: a dated dashboard search audit
A retained 5 October, 02:29 UTC dashboard audit found 39 Transporter 18 thermal frames before its detection appeared in the public index. A dated update records the changed source classification.
Read articleGravity-1’s four EEZ rows: count areas and claim labels separately
A Gravity-1 dashboard case separates four EEZ rows, five modeled-area links and seven claim-name appearances, with source labels and limits preserved.
Read articleRead USSF-385’s 178 satellite crossings as a dated model snapshot
Audit USSF-385’s 178 historical crossing entries. Read the check time, sort the list and keep expired model labels separate from collision-risk conclusions.
Read articleThree detections, two launch sites: keep every event on the map
A three-record LaunchDetect snapshot shares two coordinate pairs. Trace an order-dependent overwrite and preserve every event ID in a grouped site inventory.
Read articleSmile’s 45-hour aurora watch: a test against its achieved orbit
A reproducible orbit model gives Smile 44.1 hours above its imaging gate. Compare that opportunity with the newly released aurora images.
Read articleEarthCARE’s volcanic plume: what the grey gap leaves unresolved
An audit of nine labels in ESA’s Anak Krakatau composite separates detected features, presumed ash and the region neither radar nor lidar resolves.
Read articleSPRITE has launched. Eight galaxy forecasts show its next test
SPRITE launched on October 1. Eight pre-launch galaxy forecasts show how wider ultraviolet bins change predicted signal-to-noise, and what remains unproven.
Read articleNASA’s Gandak flood images: why two same-date maps differ
NASA’s October 2 Gandak images show late-September flooding. A reproducible test explains why two flood composites ending on the same date can differ.
Read articleSDA’s fourth transport plane: the 21-satellite count, with its limits
A six-row evidence ledger tests what SDA’s planned 21-satellite launch would add to its 126-spacecraft Transport Layer and what remains unverified.
Read articleGOES file clocks: a 192-file audit of scan and archive timing
A 192-file GOES-16 audit shows why scan start, scan end, creation and archive modification produce different timing intervals.
Read articleWhy one asteroid has two speeds in JPL’s close-approach data
Check v_rel and v_inf across 482 JPL records, including 2024 XA’s 4.574 km/s gap, and see why the two speed fields cannot be swapped.
Read articleThe September 2017 flare: comparing NOAA’s X9.3 and X14.6 records
Compare the 2017 flare bulletin, GOES-15 operational readings and a GOES-16 science-report peak, with a reproducible scaling-only test.
Read articleNASA’s sea-level zero point: a 1,093-row baseline audit
NASA’s classroom sea-level series adds 38.56 mm to every source value. Audit all 1,093 rows and see which changes that shift preserves.
Read articleSame ABI band, different response: GOES-16 and GOES-18 compared
Compare GOES-16 and GOES-18 response functions in Bands 7 and 12, with a 32-table integral audit and explicit definitions of band center.
Read articleApollo 11’s fuel margin: what the 45 seconds and 770 pounds actually counted
Reconcile Apollo 11’s 30-second call, 45-second depletion estimate and 770-pound propellant remainder with the mission report’s clocks and mass ledger.
Read articleMars Climate Orbiter: why the record contains 226, 150–170, 110 and 57 kilometers
Follow Mars Climate Orbiter’s 226, 150–170, 110 and 57 km approach figures through target, estimate and reconstruction, then audit the impulse-unit error.
Read articleVoyager at Jupiter: why 350,000 km and 280,000 km can describe one flyby
Audit Voyager’s Jupiter flyby distances by keeping center distance, cloud-top altitude and each archive’s Jovian-radius definition separate.
Read articleJuno’s orbit changes, reconstructed from 77 perijove dates
Calculate 76 intervals from NASA’s 77 Juno perijove dates, track the moon-encounter steps, and separate historical cadence from the unflown 14-day plan.
Read articleIngenuity’s longest, farthest and highest flights were different records
Audit Ingenuity’s duration, distance, altitude and speed records across all 72 flights, with full data and a peak-speed versus whole-flight comparison.
Read articleGOES pixel area: why a “2 km” cell covers 5.10 km² at Cape Canaveral
Reproduce a five-location GOES-16 grid test: the Cape Canaveral cell covers 5.10 km², while Seattle’s covers 15.10 km². Grid area is not resolution.
Read articleSentinel-1 pairing: two descending scenes can still use different tracks
Audit six Paris Sentinel-1 RTC records: every adjacent-date pair changes track, including one pair with matching descending labels. Three same-track pairs remain.
Read articleTROPOMI’s 2019 pixel-size change, checked in two NO₂ orbit files
Calculate 210 actual pixel polygons around TROPOMI’s August 2019 transition. Sampled mean area falls 22.217%, rather than the ratio of rounded size labels.
Read articleMOD16’s year-end trap: a higher ET total with a lower daily rate
A real MOD16 grid cell rises from 4.2 to 4.4 mm, but its five- and six-day periods yield a lower daily rate. Reproduce the denominator check.
Read articleMCD12Q1 class codes: same year, different land-cover dictionaries
A 25-cell MODIS audit finds 23 numerical mismatches between two schemes in the same 2020 file. Similar labels can differ, and matching numbers can mislead.
Read articleLooking for a specific launch?
The public map links each launch to its published evidence record.
Periodic launch briefings
Weekly launch outlooks and monthly activity reviews from LaunchDetect.
Register for briefings
Email confirmation required before distribution.