Launch Watch · Spaceflight
Published
2,815 exoplanet masses came from a mass–radius relationship
Audit a 5,844-planet archive extract: provenance labels, calculated values and blank fields reveal why a filled mass column needs more than a number.
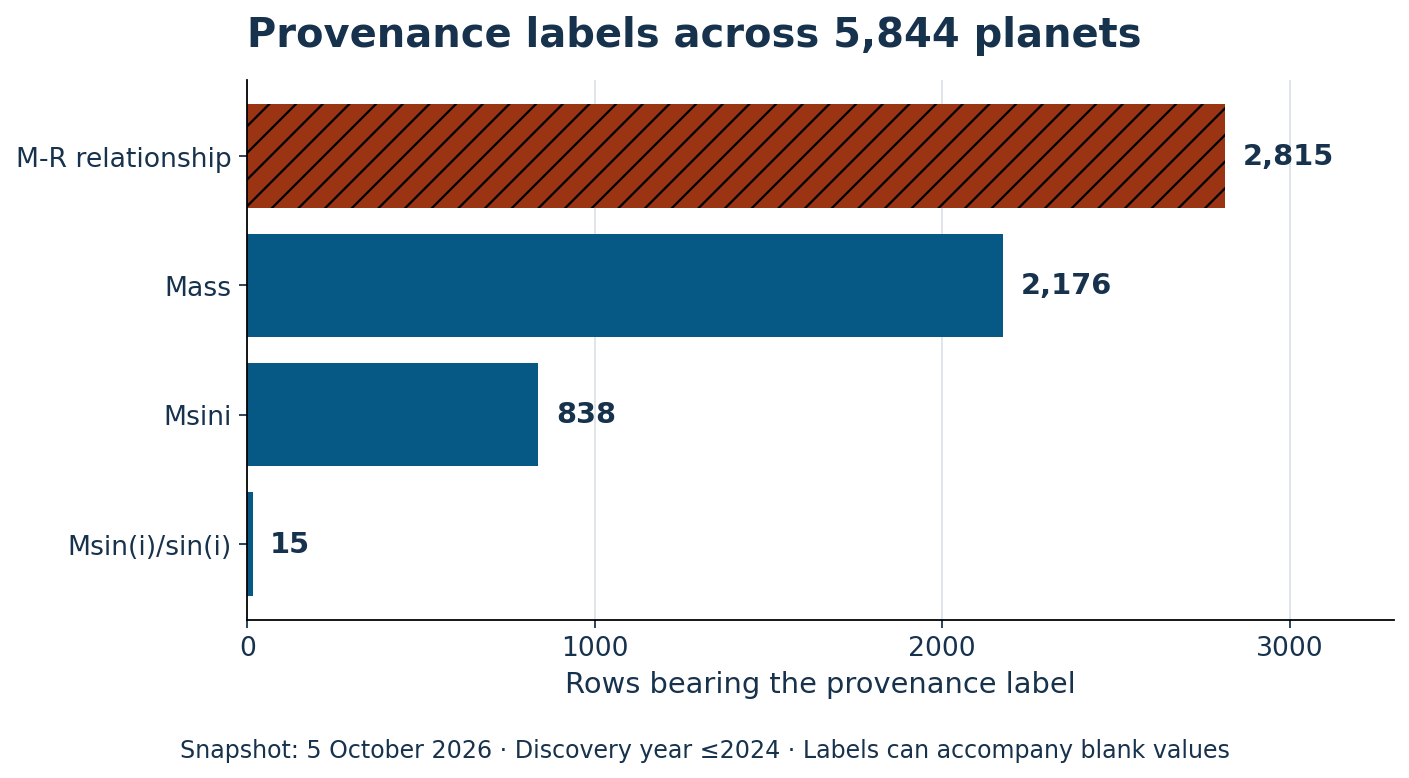
A mass column can contain a number even when that planet’s mass was filled using a relationship with its radius. In a 5,844-planet extract from the NASA Exoplanet Archive, 2,815 rows carry the mass-provenance label “M-R relationship.” That is 48.17% of the selected rows.
The selection matters. We downloaded the Planetary Systems Composite Parameters table on October 5, 2026 and selected discovery years through 2024. This is a 2026 snapshot of an older-discovery cohort. It does not reconstruct what the archive contained at the end of 2024.
Read the label beside the number
The archive’s column definitions distinguish the best-available mass value from its provenance. Counting the provenance field gives four categories in this extract:
| Archive label | Rows | Share of all rows |
|---|---|---|
| M-R relationship | 2,815 | 48.17% |
| Mass | 2,176 | 37.23% |
| Msini | 838 | 14.34% |
| Msin(i)/sin(i) | 15 | 0.26% |
“Msini” represents mass multiplied by the sine of orbital inclination; it is not interchangeable with an unqualified mass. The “Msin(i)/sin(i)” category identifies the inclination-corrected form. Even the broad “Mass” label does not by itself certify a direct, model-free measurement. Its reference and uncertainties still matter.
The archive documents how it fills some gaps
The archive’s calculation documentation describes its use of the Chen and Kipping mass–radius relationship to supply some missing mass or radius values. A calculated parameter is marked in that parameter’s reference field. These generated values have no archive-reported uncertainties.
We therefore checked the reference fields independently of the mass-provenance label. All 2,815 mass–radius relationship rows also have a calculated mass reference in this extract. Separately, 1,367 rows have a calculated radius reference. No row in this particular extract has both references marked calculated.
| Check | Rows | What the count means |
|---|---|---|
| Mass reference marked calculated | 2,815 | Matches the M-R relationship category in this extract |
| Radius reference marked calculated | 1,367 | A separate field check |
| Neither reference marked calculated | 1,662 | Does not establish two measured values |
| Neither marked calculated; both numbers present | 1,592 | Still requires references, uncertainty and limit checks |
| Blank numeric mass | 30 | A provenance label can still be populated |
| Blank numeric radius | 47 | Seven rows are blank in both numeric fields |
The missing-value check catches a subtle trap: 30 numeric masses are blank even though their provenance fields are populated. Treating every label as proof of a usable number would count those rows incorrectly. The 2,815 calculated masses are 48.42% of the 5,814 nonblank masses, compared with 48.17% of all 5,844 rows. Both percentages are valid only with their denominators attached.
Why 1,662 becomes 1,592 before any physics
A simple “neither field says calculated” filter leaves 1,662 rows. Requiring both the mass and radius numbers to be present reduces that to 1,592. The 30 blank masses and 47 blank radii overlap in seven rows, so 70 rows fail the combined presence test: 30 + 47 − 7 = 70.
That is still not a selection of 1,592 independently measured, mutually consistent mass–radius pairs. The composite-table overview explains that parameters can come from different literature references. A particular planet’s entries need not constitute one self-consistent published solution.
If you want to calculate a density or compare planets physically, inspect the provenance, references, uncertainties and upper/lower-limit flags first. For a within-publication parameter set, the archive’s separate Planetary Systems table organizes rows by planet and reference. This article stops at catalog-field auditing; it does not infer composition or population completeness.
Reproduce the field audit
The 5,844-row audit CSV includes planet name, discovery year, the mass-provenance label, numeric-presence flags, and the two calculated-reference flags. Each flag is 1 for yes and 0 for no. The names are unique in the selected extract.
Start with the exact archive query if you want a fresh source extraction. It selects the PSCompPars table, filters discovery year to 2024 or earlier, and orders by planet name. Fresh results can change as references and catalog records are revised, so they should be treated as a new snapshot.
Count each mass-provenance label, then count the calculated-reference and presence flags separately. Keeping those checks separate is the main reusable lesson: a category label, a nonblank cell and a measurement claim are three different pieces of evidence.
Sources and archive acknowledgment
- Archive column definitions, including mass provenance, references, uncertainty and limit fields.
- How calculated composite parameters are populated.
- About the composite table, including its scope and consistency limits.
- Archive acknowledgment guidance and Christiansen et al. (2025), the archive overview.
This research has made use of the NASA Exoplanet Archive, which is operated by the California Institute of Technology, under contract with the National Aeronautics and Space Administration under the Exoplanet Exploration Program. The chart and field-count analysis are original LaunchDetect work; no archive illustration or literature figure is reproduced. No NASA or Caltech endorsement is implied.