Launch Watch · Current evidence
Published
Greenland’s 2019 mass rebound: what 76 gigatons restored
Reproduce a 622-gigaton decline and 76-gigaton rebound in Greenland’s monthly gravity-derived mass record, with source bounds and careful date labels.
Greenland’s monthly mass curve turned upward late in 2019, but the increase was small beside the preceding decline. In the public NASA Earth Indicators chart, the May-to-September change is −621.88 gigatons. The September-to-December change is +75.75 gigatons, about 12.18% of that earlier drop.
A rising line can therefore show a real increase between two monthly estimates while leaving most of a preceding loss unrecovered. The useful question is “How much, over which interval?” Here, three endpoints answer it without treating a short rebound as a reversal of the longer record.
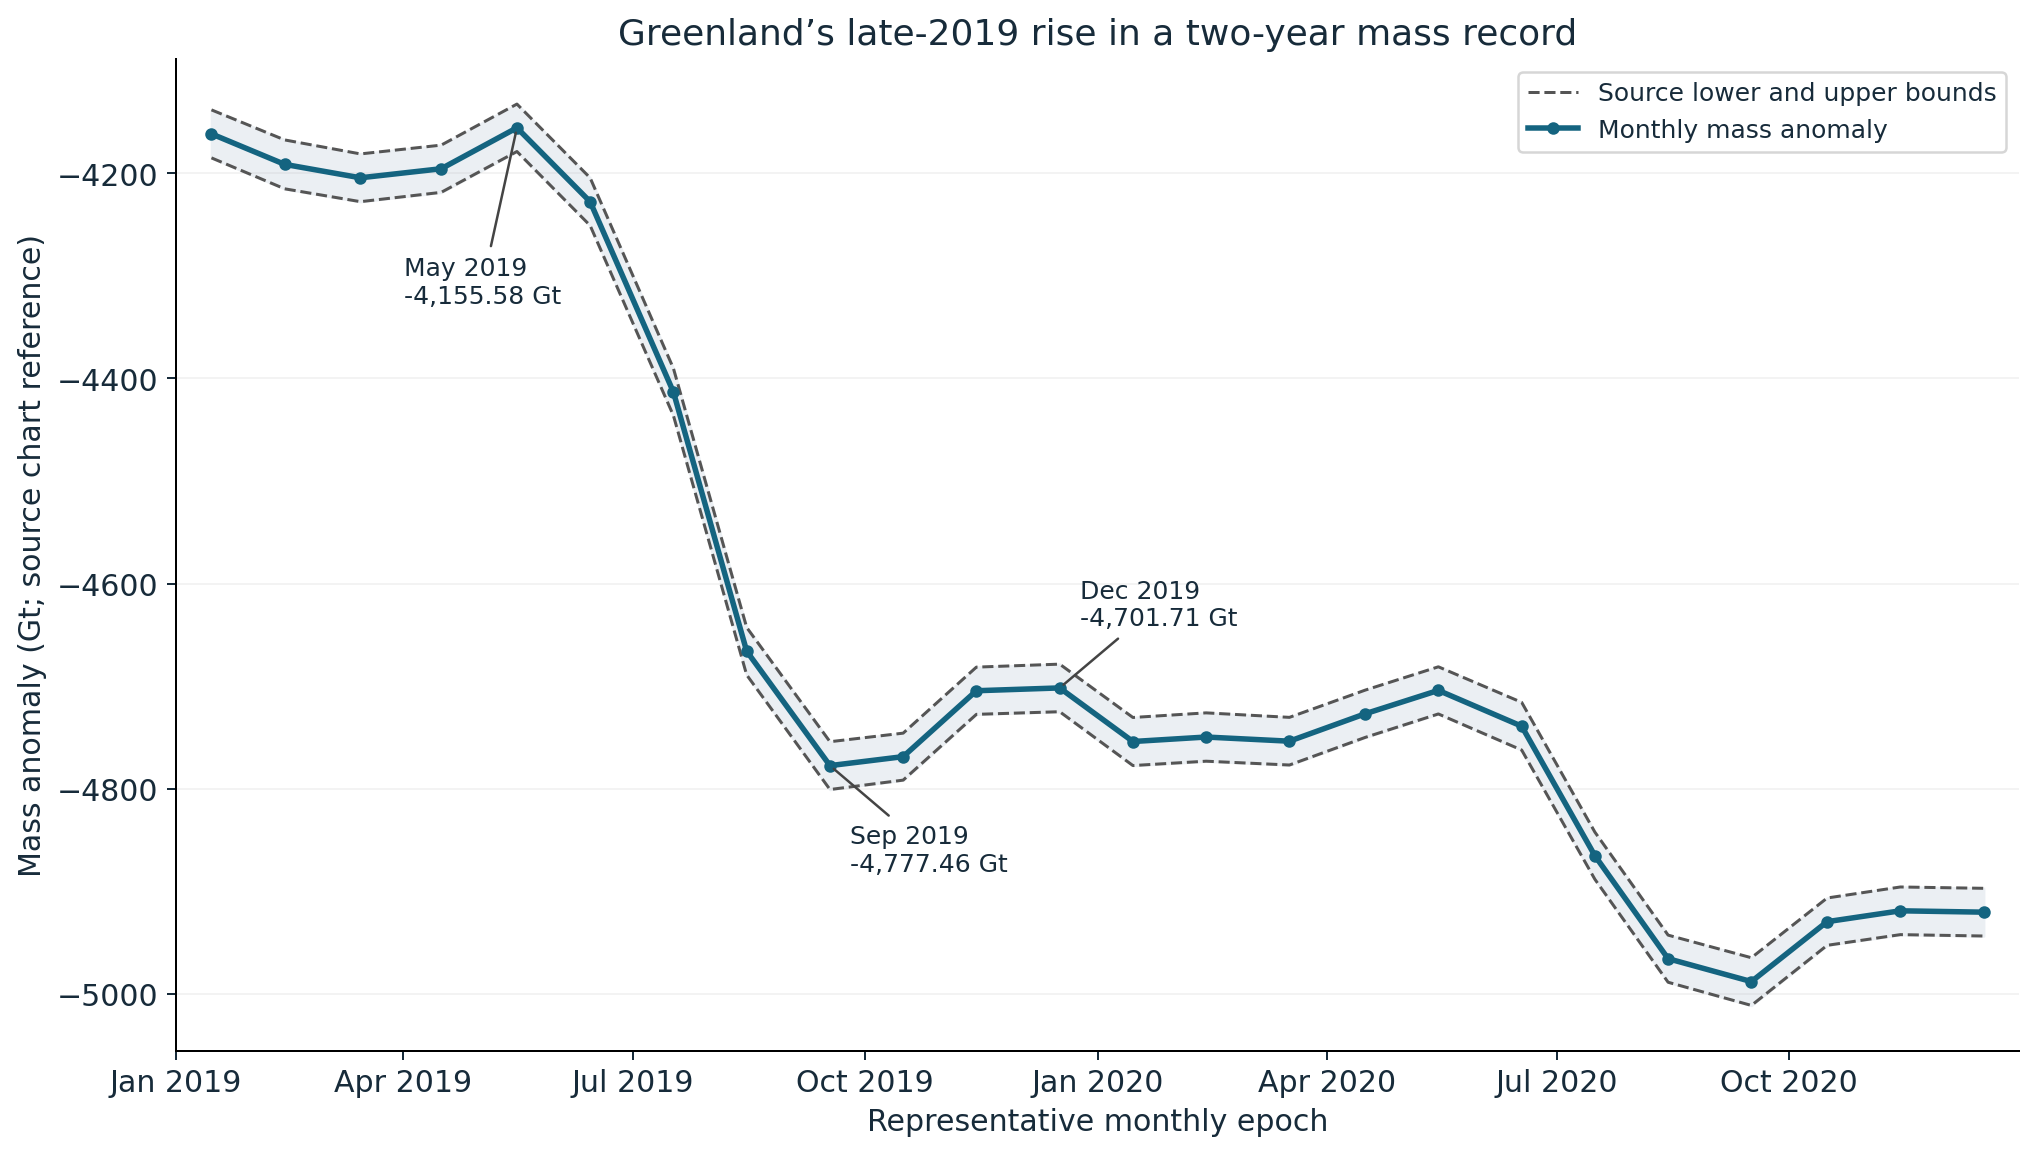
The three endpoints behind the result
| Monthly entry | Representative date | Mass anomaly | Source lower–upper bounds |
|---|---|---|---|
| May | 16 May 2019 | −4,155.58 | −4,178.71 to −4,132.45 |
| September | 17 September 2019 | −4,777.46 | −4,800.76 to −4,754.16 |
| December | 17 December 2019 | −4,701.71 | −4,724.90 to −4,678.52 |
First subtract May from September: −4,777.46 − (−4,155.58) = −621.88 Gt. Then subtract September from December: −4,701.71 − (−4,777.46) = +75.75 Gt. Dividing 75.75 by 621.88 and multiplying by 100 gives 12.18%.
Another way to keep the accounting straight is to compare May directly with December. The December value remains 546.13 Gt below May. The late-year increase reduced the earlier endpoint-to-endpoint loss; it did not return the curve to the May level.
One gigaton is one billion metric tons. The negative chart values describe a mass anomaly relative to the source chart’s reference, rather than a negative amount of ice. For this calculation, subtracting two entries in the same record cancels a common reference offset. We leave the chart’s reference intact rather than rebasing it or claiming a new estimate of Greenland’s total ice mass.
Why the dates are labels for monthly estimates
The source file gives a year, month, day and decimal-year coordinate for each point. We retain those dates in the downloadable data so another reader can select exactly the same entries. A point labeled 17 September is still a representative monthly chart epoch. It is not an instantaneous measurement of the whole ice sheet on that day.
This distinction matters when naming a difference. “May-to-September monthly-epoch change” identifies the calculation we performed. “Summer melt” would imply a different physical quantity and potentially different start and end dates. Our numerator is likewise September-to-December change, not a measurement of all winter accumulation.
The two-year chart includes all 24 monthly entries for 2019–2020. Extending the display beyond December makes it harder to mistake a selected three-month rise for the whole trajectory. We have not fitted a new trend line or chosen a percentage from a smoothed version of this extract.
What the gravity record measures
The Earth Indicators ice-sheet page identifies GRACE and GRACE Follow-On as the observing missions behind the record. Their gravity measurements support estimates of changing ice-sheet mass. A mass change can reflect several contributions, including accumulation and losses through runoff or ice discharge. This three-endpoint subtraction does not partition those contributions.
We preserve the chart’s source uncertainty bounds at every epoch. They show information the point estimates alone would hide. However, a bound around each monthly value is not automatically a bound around the difference between two months. Errors may be correlated, and the downloaded chart does not provide the covariance needed to derive that difference uncertainty.
For the same reason, the 12.18% is an arithmetic ratio of point-estimate changes. We do not attach an invented confidence interval or claim that the two-decimal percentage is the physical precision of the result. Rounded language such as “about 12%” is appropriate when describing its size.
Keep an annual research result separate
The 2020 report on Greenland’s 2019 loss describes a published annual estimate of 532 billion tons. That study combined GRACE/GRACE-FO information with models of snowfall and ice-sheet melting. Its annual result addresses a different calculation from the monthly endpoints used here.
Even January-to-December subtraction in the current chart gives a different number: −4,701.71 − (−4,161.51) = −540.20 Gt. Those entries are represented by 15 January and 17 December, rather than exact calendar-year boundaries. Differences in processing and temporal definitions also matter. The 540.20, 621.88 and 532 figures should not be exchanged just because each concerns 2019.
Check the arithmetic yourself
Download the 24-row monthly extract, including representative dates, decimal years, mass anomalies and both source bounds. The key endpoints and calculations are visible above, so reading the result does not require JavaScript or access to the original interactive chart.
- Use the linked numeric chart file or the CSV, retaining the source units in Gt.
- Select May, September and December by their year and month, not by an assumed row number in the full record.
- Calculate later value minus earlier value for each change.
- For the recovered fraction, divide the positive late-year change by the magnitude of the earlier decline.
- Report the exact intervals and preserve the provider’s uncertainty information separately.
This extract was checked against the chart file retrieved on 5 October 2026. The source is updated over time, so a later download may reflect revised estimates. The result is a reproducible example of seasonal mass accounting, not a new attribution study or an assessment of present-day ice conditions.
Source credit: NASA Earth Indicators, GRACE/GRACE-FO. The numeric chart points are the source of all calculations here. This AI-assisted article and original LaunchDetect graphics have not been reviewed or endorsed by NASA; NASA is not responsible for this interpretation. No third-party imagery is reproduced.