Space above us.
The ocean below.
Read the launch record. Follow the people in orbit. Explore how the paths to space connect with the world we share.
Open the live globe →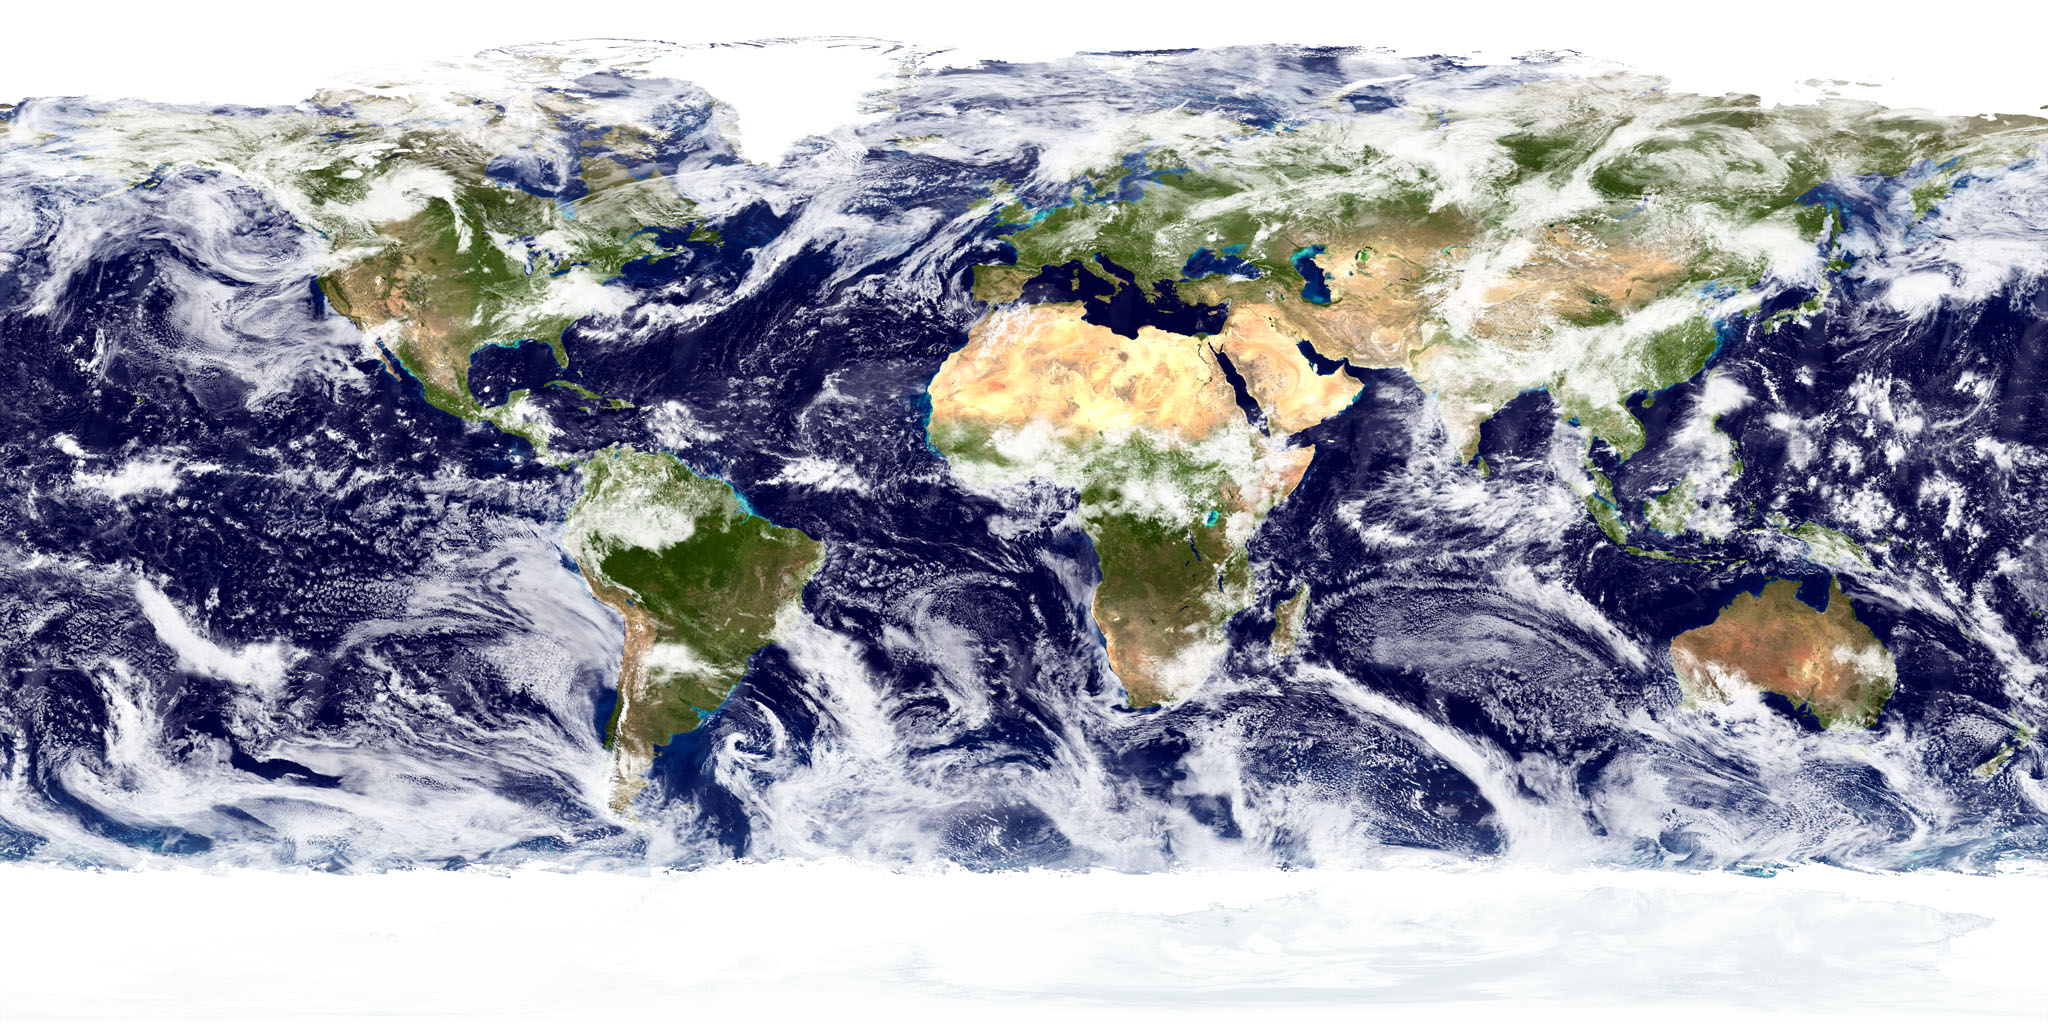
Field notes
Guides to the public mapSame Arctic ice area, different extent: September 2016 and 2024
Arctic sea-ice area is 2.91 million km² in both September rows, but extent falls 4.0%. Reproduce the NSIDC comparison and see why both can be true.
Read articleMauna Loa in two satellite views: a bright-light artifact and a color-scale ceiling
A Mauna Loa night image has a recovery streak; an SO₂ map ends at 100 DU. Compare the instruments, printed values and eleven-hour timing gap.
Read articleLake Erie’s 2011 bloom on one map grid: what the images can show
Register the October 5 Landsat and October 9 MODIS bloom images to one footprint, then separate visible color, biomass estimates and toxin measurements.
Read articleWhy the warmest Niño region had the smallest anomaly in November 2015
Niño 4 was warmer than Niño 3.4 but less anomalous. Reproduce four weeks of NOAA SST data and see how regional baselines reverse the ranking.
Read articleKp and Ap rank two 2024 storm days differently: a 366-day audit
May 10 and October 8 have nearly equal mean Kp but daily Ap of 105 and 54. Reproduce all eight intervals and the full 2024 aggregation check.
Read articleGOES-16 in 2019: an audited calibration review calendar
Audit 29 GOES-16 calibration-log rows from 2019, including a repeated gap notice, distinct same-day intervals and band-specific review points.
Read articleFalcon Heavy in GOES imagery: two products and two clocks
Inspect NOAA’s 2019 Falcon Heavy imagery: separate the water-vapor still from the visible sequence and acquisition labels from GIF playback.
Read articleChelyabinsk: comparing radiated light with estimated impact energy
Convert Chelyabinsk’s reported radiated energy to 89.6 kt, compare it with the 441-kt impact estimate, and keep source revisions visible.
Read articleTest satellite-map axis order with a real NASA GIBS scene
A reproduced WMS 1.1.1 and 1.3.0 test matches NASA GIBS pixels, while a wrong-axis request returns HTTP 200 and a black image.
Read articleLake Mead’s 276 monthly readings: what elevation can tell us
An audit of Lake Mead’s 2000–2022 monthly elevations finds a 169.44-foot endpoint decline, 111 rises and clear limits on storage claims.
Read articleWhy one California launch window spans two UTC dates
Convert a real October 2026 Starlink interval between UTC and California time, keeping both endpoints and the source-read date intact.
Read articleEuropa Clipper after Milton: a launch-date change in three NASA records
Trace Europa Clipper’s prior October 10 target, conditional October 14 plan and confirmed liftoff, while keeping source dates separate from event dates.
Read articleGOES-U, GOES-19 and GOES East: one satellite, three dated labels
Resolve GOES-U and GOES-19 against five real commissioning milestones, and separate first-image acquisition, public release and the GOES East handover.
Read articleEPIC’s green Moon edge: inspect a real color-timing artifact
An untouched NASA EPIC frame and 31 reproducible RGB samples show what a colored edge can establish, and why display pixels are not raw sensor channels.
Read articlePACE launch weather: compare forecasts for the same target day
Four NASA PACE forecasts show why issue dates and launch dates belong on separate axes, and why the comparable revision is 60% to 50%.
Read articleCaldor Fire maps: three layers, three different training labels
A worked reading of two Caldor Fire frames separates active detections, front history and burned area before they become machine-learning labels.
Read articleSaharan dust in 2020: a map and a lidar slice answer different questions
Read real GEOS maps beside a CALIOP transect to separate modeled dust optical thickness, sampled plume height and unsupported regional claims.
Read articleHuntington Beach oil-spill images: the 16-hour comparison gap
Two real 2021 spill images reveal different observables. Reproduce their 16-hour-33-minute time gap before comparing Landsat and Sentinel-1B.
Read articleBlack Marble HD: what a 30-meter output grid really adds
Work through the 500-to-30-meter grid ratio in a real Black Marble HD study, without confusing sharper output with independent night observations.
Read articleDART’s 2024 period numbers: why 18 seconds go missing
Reproduce DART’s reported orbital-period arithmetic and see why a rounded 11h55m baseline cannot recover a second-level change.
Read articleCrew-13 launch status: what EventScheduled actually means
A worked Crew-13 record comparison separates NASA liftoff evidence, LaunchDetect status, Schema.org semantics and timestamp precision.
Read articleCuba 2019: the lightning mapper frame that contains a meteor
A two-region audit of a real GOES-16 frame shows why a lightning product name cannot classify every optical signal it contains.
Read articleHarvey at Rosharon: why a week-late Landsat image still caught high water
A 32-day USGS river record explains why the September 5, 2017 Landsat image still showed high water seven days after the highest daily mean.
Read articleThe 2024 eclipse: a real test of a simple image-change rule
Reproduce a 48-frame NOAA eclipse-video test: one fixed patch triggers 17 change flags, while a comparison patch triggers none at the same threshold.
Read articleLooking for a specific launch?
The public map links each launch to its published evidence record.
Periodic launch briefings
Weekly launch outlooks and monthly activity reviews from LaunchDetect.
Register for briefings
Email confirmation required before distribution.