Launch Watch · Dashboard evidence
Published
Gravity-1’s four EEZ rows: count areas and claim labels separately
A Gravity-1 dashboard case separates four EEZ rows, five modeled-area links and seven claim-name appearances, with source labels and limits preserved.
Gravity-1’s Fishing zones & launch areas panel contained four rows when inspected at 02:27:55 UTC on 5 October 2026, still 4 October in Hawaii. Those rows produce three other valid totals: five links to modeled area types, seven appearances of state or claim names, and four distinct names. Each number describes a different feature of the published result.
This case uses the Gravity-1 / SpaceSail Polar Group #16 dashboard record. Its modeled-area evidence carried an update time of 28 September 2026 at 16:05:40 UTC. The arithmetic below describes that inspected snapshot; later versions of the panel may differ.
Start with the complete four-row matrix
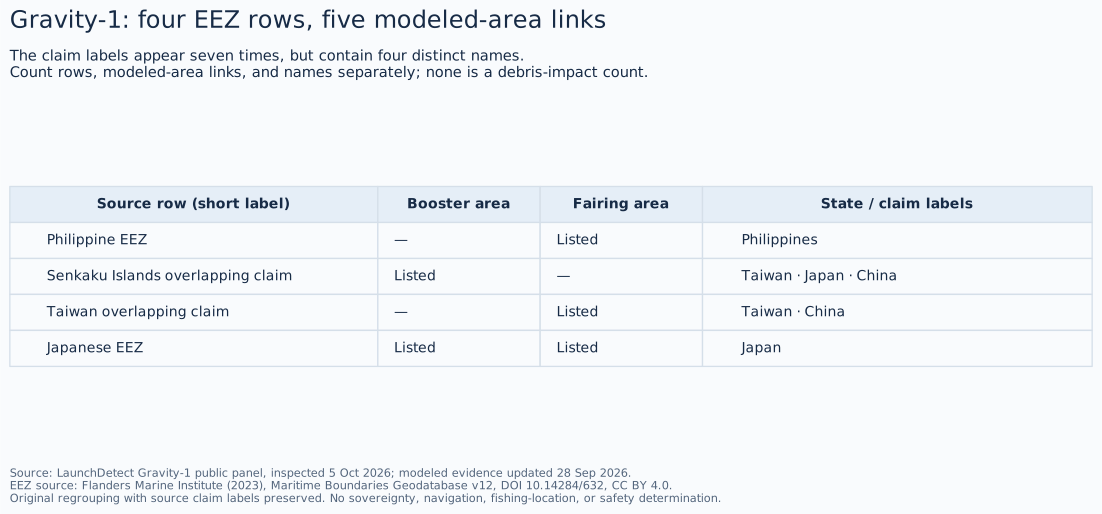
The table preserves the displayed source labels and the separate State / claim field. A listed association means the dashboard connected that source row to that modeled area class. “Not listed” records the absence of that association from this panel, without making a wider claim about the sea surface.
| Displayed source row | Booster impact area | Fairing impact area | State / claim labels |
|---|---|---|---|
| Philippine Exclusive Economic Zone | Not listed | Listed | Philippines |
| Overlapping claim Senkaku Islands: Taiwan / Japan / China | Listed | Not listed | Taiwan; Japan; China |
| Overlapping claim Taiwan: Taiwan / China | Not listed | Listed | Taiwan; China |
| Japanese Exclusive Economic Zone | Listed | Listed | Japan |
Reproduce all four totals
First count the displayed source rows: four. Next count each row-to-area-class link. The Philippine row contributes one, the Senkaku overlapping-claim row one, the Taiwan overlapping-claim row one, and the Japanese row two. That gives 1 + 1 + 1 + 2 = 5 associations, divided into two booster and three fairing associations.
For names, use the separate State / claim column once per source row. Its lengths are 1, 3, 2 and 1, giving seven name appearances. Deduplicating those strings gives China, Japan, Philippines and Taiwan: four distinct source names. Do not count a name again because it also occurs in the row’s descriptive label.
The Japanese row explains why the units matter. It is one displayed source row associated with both booster and fairing area classes. Expanding it into two rows is useful for a spreadsheet, provided the source-row identity stays attached. It does not establish two separate boundary geometries, two physical objects or two confirmed debris landings. Likewise, three names on the Senkaku overlapping-claim row remain three labels within one source row.
The companion CSV uses one row per association, so it has five data rows. Counting its rows reproduces the association total; counting distinct source-row numbers reproduces the four-row panel. That small check prevents a normal spreadsheet transformation from silently changing the meaning of the headline.
Repeat the dashboard check
- Open the linked Gravity-1 record in Explore and verify the mission name, SpaceSail Polar Group #16. Keep the permanent launch report with the record identity.
- Expand Fishing zones & launch areas. Copy each full source row, its area labels and its State / claim labels before shortening anything for a chart.
- Record the modeled-evidence update time separately from your inspection time. The September update and October inspection answer different questions.
- Preserve the missing launch-site-country field. The inspected panel said no launch-site country was supplied for this location. The overlap names cannot fill that field.
- Count source rows, associations and name appearances separately. If you split multi-area rows, retain a source-row key and deduplicate names only for the explicitly named distinct-name total.
The textual panel was verified in the browser used for this inspection. Its Cesium/WebGL globe failed to initialize, so this case does not claim verification of the drawn polygons, globe selections or measured intersection areas. The original matrix keeps the check reproducible without substituting an unverified map.
Keep the result’s meaning and attribution
The existing fishing-zones guide explains the general layer. This case adds the actual row-level calculation. The panel’s modeled impact-area labels do not establish that debris landed, that fishing occurred at those locations, or that fishing was affected. No impact probability, environmental effect or safety conclusion is calculated here.
LaunchDetect’s credits identify the boundary source as Flanders Marine Institute (2023), Maritime Boundaries Geodatabase version 12, DOI 10.14284/632, under CC BY 4.0. This table, CSV and figure are an original regrouping of LaunchDetect’s displayed modeled-area associations. Source claim labels are retained; figure labels are shortened; no boundary geometry is redistributed. No endorsement is implied.
Marine Regions’ source terms state that the dataset has no legal value and is unsuitable for navigation or natural-resource exploration decisions. The overlapping-claim names are source labels, without a sovereignty judgment. The useful handoff is a dated association table with its units and source intact: four displayed rows, five modeled-area links, seven name appearances and four distinct names.