Launch Watch · Current evidence
Published
SPRITE has launched. Eight galaxy forecasts show its next test
SPRITE launched on October 1. Eight pre-launch galaxy forecasts show how wider ultraviolet bins change predicted signal-to-noise, and what remains unproven.
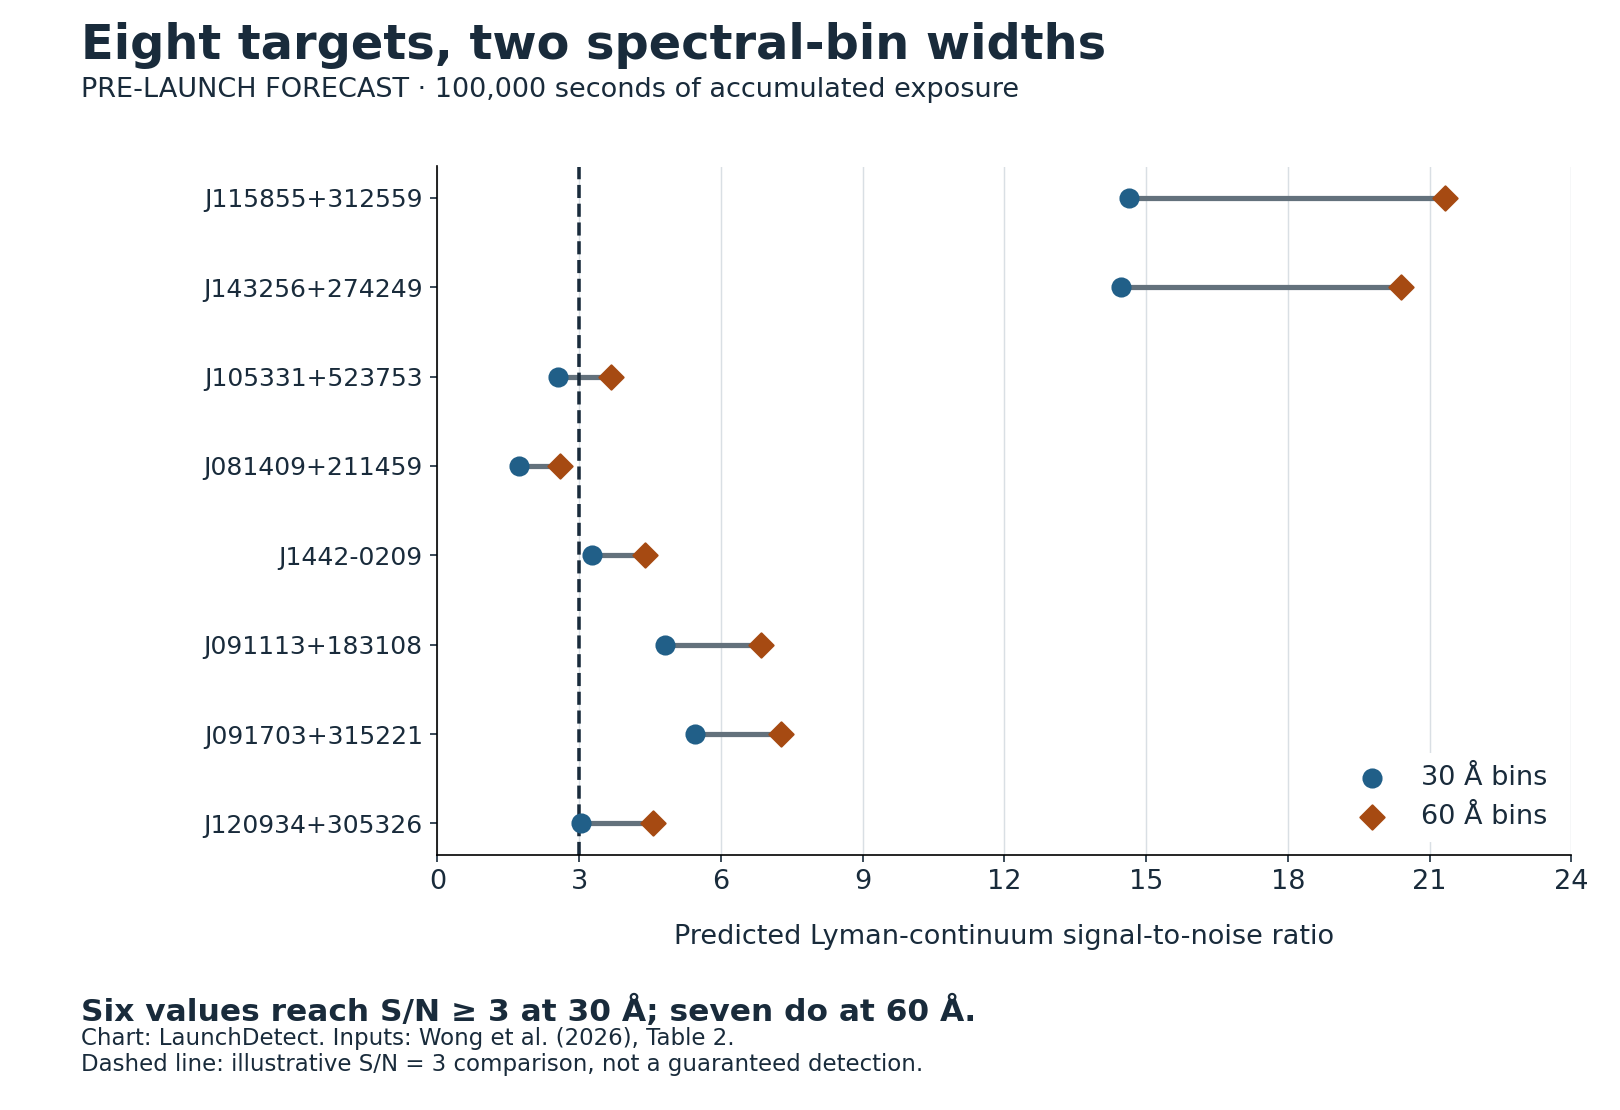
SPRITE’s October 1 launch moves a small ultraviolet telescope from ground tests toward a much harder test: measuring faint light escaping galaxies. A calculation using eight pre-launch target forecasts shows why the way a spectrum is grouped matters. Six predicted signal-to-noise ratios reach three in 30-angstrom bins; seven do in 60-angstrom bins.
NASA confirmed the launch on SpaceX’s Transporter-18 mission from Vandenberg, California. The University of Colorado Boulder’s Laboratory for Atmospheric and Space Physics developed and operates SPRITE with NASA funding. The launch establishes that the mission has left Earth. The forecasts below describe a proposed science test, not results already obtained in orbit.
Why look for ultraviolet light escaping a galaxy?
Massive stars produce radiation energetic enough to ionize hydrogen. How that radiation gets out of galaxies matters to understanding how the early universe became transparent to ultraviolet light. The mission team’s explanation describes SPRITE’s combination of imaging and spectroscopy: it aims to connect the escaping light with the places in galaxies that produce it.
The eight objects here are potential commissioning targets selected in a pre-launch study by Wong and colleagues. They are lower-redshift galaxies with previously identified escaping Lyman-continuum emission, useful for testing a new instrument. They are not direct pictures of the first galaxies.
Eight forecasts, with the exposure held fixed
We extracted the two Lyman-continuum columns from Table 2 of the June 2026 pre-launch paper. Each prediction assumes 100,000 seconds of accumulated exposure, about 27.78 hours, under the study’s nominal instrument and background assumptions. That duration is exposure time collected on a target, not a promise that commissioning finishes in just over a day.
| Potential target | S/N, 30 Å bins | S/N, 60 Å bins | Calculated gain |
|---|---|---|---|
| J115855+312559 | 14.64 | 21.32 | 45.6% |
| J143256+274249 | 14.47 | 20.40 | 41.0% |
| J105331+523753 | 2.55 | 3.68 | 44.3% |
| J081409+211459 | 1.73 | 2.59 | 49.7% |
| J1442-0209 | 3.27 | 4.40 | 34.6% |
| J091113+183108 | 4.82 | 6.84 | 41.9% |
| J091703+315221 | 5.46 | 7.28 | 33.3% |
| J120934+305326 | 3.04 | 4.56 | 50.0% |
The full calculation is available as a downloadable CSV. S/N means signal-to-noise ratio; Å means angstrom, a wavelength unit. The numerical precision shown follows the paper’s forecast table.
The useful change is one threshold crossing
J105331+523753 is the only target that moves across the illustrative S/N = 3 line: its forecast rises from 2.55 to 3.68. J081409+211459 rises from 1.73 to 2.59 and stays below it. The other six already meet the line with the narrower bins.
For each row, we divide the 60 Å prediction by the 30 Å prediction, subtract one, and multiply by 100. The increases range from 33.3% to 50.0%, with a median of 43.1%. The largest percentage increase does not identify the hardest case or a new threshold crossing: J120934+305326 gains 50.0%, but was already just above three.
Changing the comparison line also changes the story. The table below applies three illustrative cutoffs to the same numbers. These are counts of forecast values, not estimated mission success rates.
| Illustrative cutoff | 30 Å bins | 60 Å bins |
|---|---|---|
| S/N ≥ 3 | 6 of 8 | 7 of 8 |
| S/N ≥ 5 | 3 of 8 | 4 of 8 |
| S/N ≥ 10 | 2 of 8 | 2 of 8 |
At a cutoff of five, the count also rises by one. At ten, it does not change. This is why “seven targets” needs its bin width, exposure assumption and comparison rule attached.
Wider bins answer a broader spectral question
A spectral bin groups light across a wavelength interval. Combining a broader interval can make a faint continuum easier to measure while surrendering fine wavelength detail. In this comparison, doubling bin width does not double S/N, and it does not double the performance of the telescope. It changes what is being measured together.
The predicted values depend on the actual light collected and the background that accompanies it. A line drawn at S/N = 3 on this chart is not a guaranteed three-sigma detection in future data. Calibration, background estimation and the statistical treatment of a real observation still matter.
What would turn a forecast into a science result?
The next useful evidence is a calibrated in-flight spectrum with its target, accumulated exposure, wavelength binning and uncertainty stated. That would let readers compare an actual measurement with an appropriate forecast. A launch announcement or a spacecraft reception report cannot establish the telescope’s ultraviolet sensitivity.
There is also more to SPRITE than this eight-target calculation. Carlson and colleagues’ mapping study describes a long-slit instrument and a push-broom observing method for galaxies and supernova remnants, with commissioning tests for calibration, pointing and data quality. Mapping where ultraviolet emission comes from and measuring a faint continuum are related scientific goals, but this table tests only the latter forecast.
The question after launch is therefore concrete: with a stated exposure and bin width, what signal and background does SPRITE actually record? These eight predictions provide a starting point for that comparison, while leaving the answer to observations.