Launch Watch · Spaceflight
Published
Ingenuity’s longest, farthest and highest flights were different records
Audit Ingenuity’s duration, distance, altitude and speed records across all 72 flights, with full data and a peak-speed versus whole-flight comparison.
Ingenuity’s longest flight was Flight 12, at 169.5 seconds. Its farthest entry in the final flight log was Flight 69, at 705 horizontal meters. Its highest flight was Flight 61, reaching 24 meters. A single “best flight” would hide three different achievements.
The speed record adds another wrinkle: Flights 62, 68 and 69 all reached a maximum groundspeed of 10 meters per second, yet their logged distance divided by total flight time ranges from 2.21 to 5.35 meters per second. Peak speed and a whole-flight distance/time ratio are different quantities.
The four record questions, checked against every row
We inspected all 72 entries in the NASA/JPL-Caltech final flight log, then independently selected the maximum of each metric column. Ties are retained rather than arbitrarily choosing one record holder.
| Question | Flight or flights | Largest published value |
|---|---|---|
| Longest time airborne | 12 | 169.5 seconds |
| Greatest horizontal distance | 69 | 705 meters |
| Highest maximum altitude | 61 | 24 meters |
| Highest maximum groundspeed | 62, 68 and 69 | 10 meters per second |
JPL’s final-record overview separately identifies Flight 61’s altitude record and the three 10-meter-per-second flights. A contemporaneous account after Flight 12 confirms its completed 169.5 seconds and 450 meters. Those checks help distinguish recorded accomplishments from proposed numbers for a following flight.
Why the longest flight was not the farthest
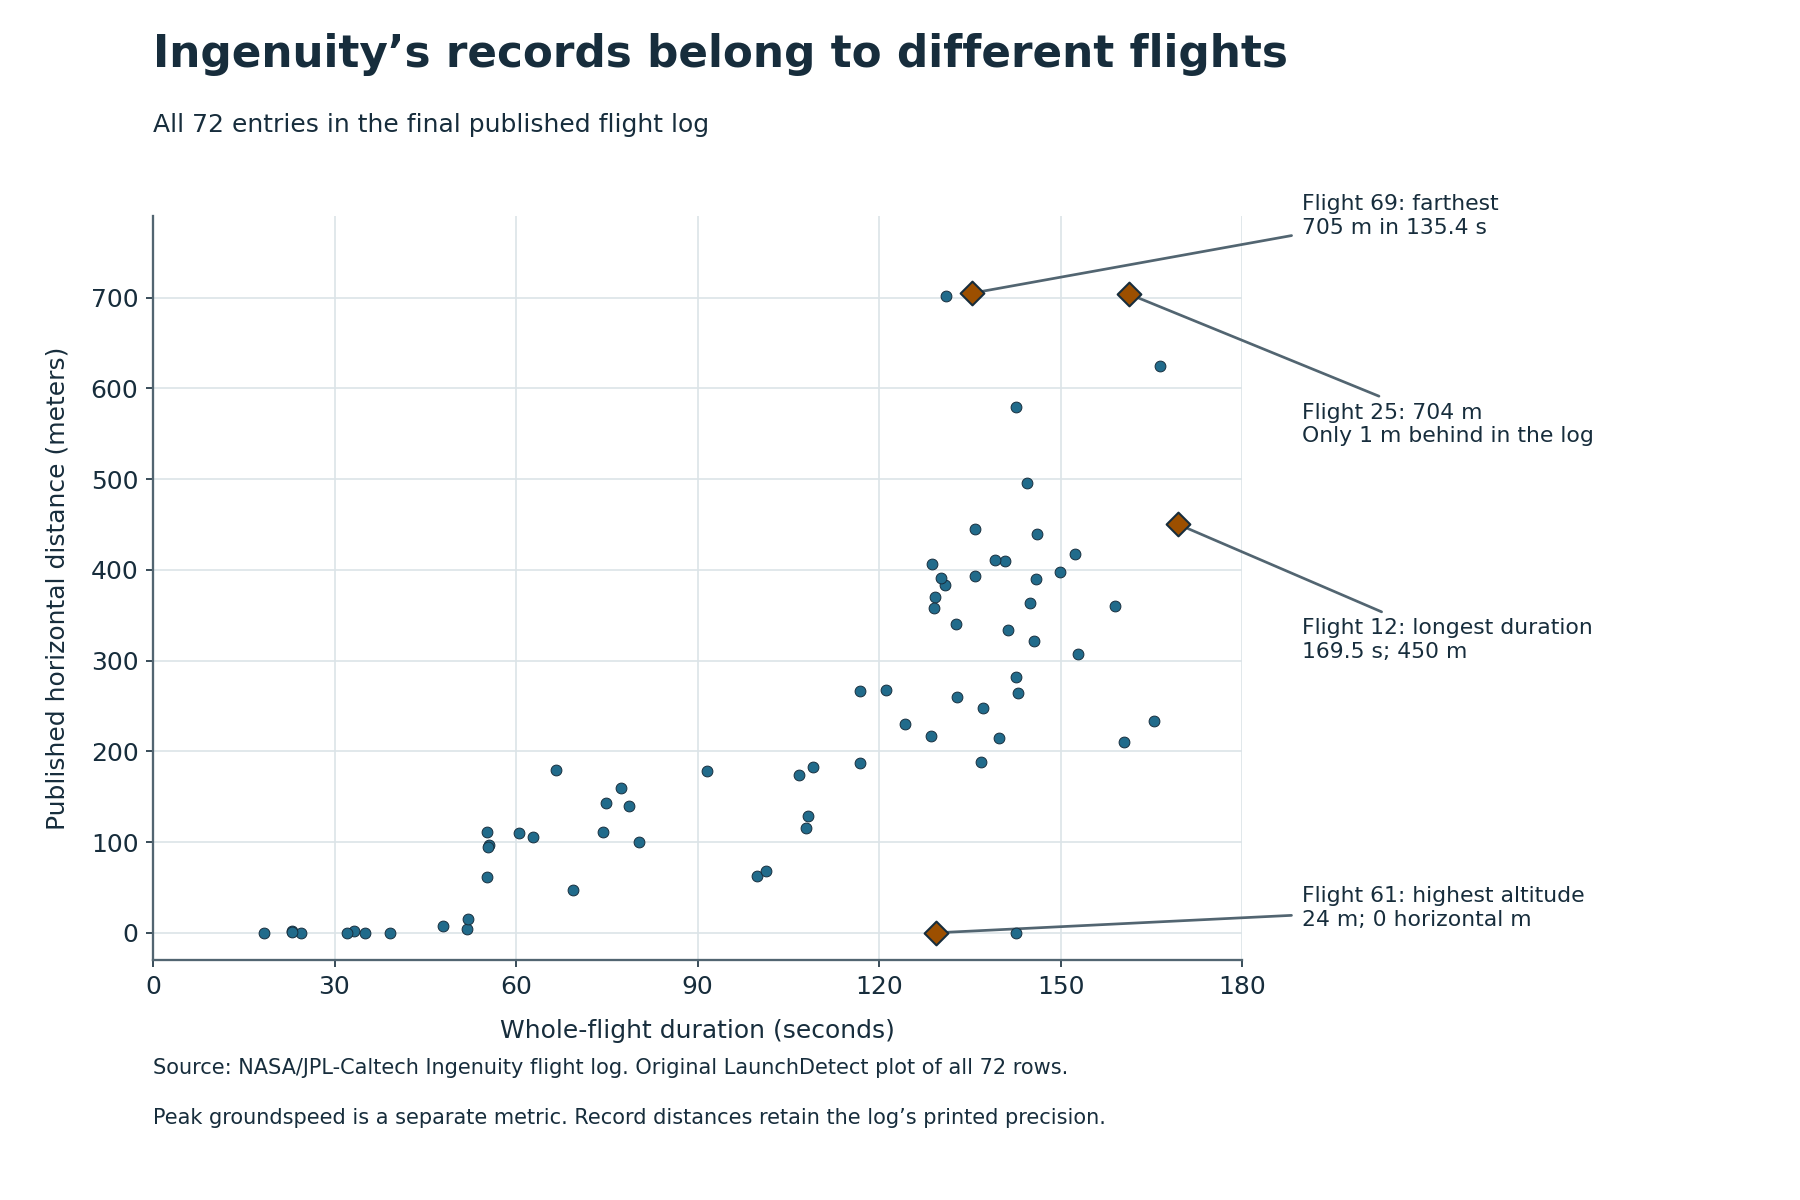
Flight 12’s 450 meters took 169.5 seconds in the table. Flight 69 covered a logged 705 meters in 135.4 seconds. It therefore has 255 more horizontal meters despite a duration 34.1 seconds shorter.
The scatterplot makes that comparison visible without compressing both axes into a score. Flight 12 is farthest to the right because it has the longest duration. Flight 69 is highest on the horizontal-distance axis. A point’s position on one axis cannot determine its ranking on the other.
Flight 25 is close to Flight 69 in distance: 704 versus 705 meters. The nominal lead is just one meter at the log’s printed precision. The table does not supply the uncertainties needed to turn that one-meter ranking into a claim about statistically distinguishable performance. “Largest published distance” is the defensible description.
The altitude record belongs to a hover test
Flight 61 has a maximum altitude of 24 meters and zero logged horizontal distance. Those fields can coexist: one describes height, while the other describes horizontal travel. NASA’s engineering account of the test campaign describes the high hover and the subsequent high-speed forward-flight work.
The highest-flight annotation sits on the plot’s zero-horizontal-distance line because the chart axes are distance and duration. Altitude is supplied in the label and record table; it is not encoded by the point’s vertical position. The 24-meter flight would be easy to miss if “most impressive” were defined only by horizontal range.
Why distance divided by time does not reproduce 10 m/s
| Flight | Horizontal distance | Total duration | Distance ÷ duration | Maximum groundspeed |
|---|---|---|---|---|
| 62 | 268 m | 121.1 s | 2.21 m/s | 10 m/s |
| 68 | 702 m | 131.1 s | 5.35 m/s | 10 m/s |
| 69 | 705 m | 135.4 s | 5.21 m/s | 10 m/s |
The ratio uses the log’s horizontal distance and the duration of the whole flight. The peak-speed column instead records the maximum groundspeed reached. Dividing two whole-flight totals cannot recover a maximum within the flight.
For Flight 62, 268 ÷ 121.1 gives about 2.21 meters per second. Flights 68 and 69 give about 5.35 and 5.21. All three retain the same published 10-meter-per-second peak. These ratios describe the table’s totals; they are not measurements of maximum speed, average airspeed or necessarily net displacement divided by time.
The source does not provide a complete speed-versus-time history here. It would be unjustified to use these columns alone to allocate exact seconds to hovering, acceleration or cruise, or to rank aerodynamic efficiency.
What adding the published rows gives
Summing all 72 horizontal-distance entries gives 16,971 meters, or 16.971 kilometers. The durations add to 7,731.3 seconds, or 128.855 minutes. The PDF’s summary separately presents approximately 17.0 kilometers and 128.8 minutes.
The distance sum is consistent with a 17.0-kilometer rounded summary. The sum of printed durations exceeds 128.8 minutes by 3.3 seconds. This calculation does not establish the reason for that small mismatch. The inputs are rounded public entries, so neither sum should be promoted into a more authoritative raw-telemetry mission total.
Method and limits
The 72-flight CSV retains the flight number, sol and four metric columns, with a separately named calculated distance-over-total-duration field. We check that flights 1 through 72 appear once each, find maxima with all ties included, add distance and duration, and calculate ratios directly from the retained inputs.
Flight 71 is preserved exactly as published: zero horizontal meters, 7 meters per second maximum groundspeed and 35 seconds duration. That unusual combination should not be quietly repaired or treated as proof of zero physical motion. We do not use it to fit a speed-distance model.
The PDF’s Earth dates use the Pacific time zone at the time of each flight. This table retains the source’s sol identifiers and does not relabel its Earth dates as UTC. The article is an audit of the final historical log, not a forecast of future flights.
To compare an Ingenuity record, name the column first: duration, horizontal distance, maximum altitude or maximum groundspeed. Then retain the log’s precision and keep derived whole-flight ratios in their own column. That preserves what each flight actually demonstrates in this dataset.
Read the full 72-flight metric table
| Flight | Sol | Horizontal distance (m) | Maximum altitude (m) | Maximum groundspeed (m/s) | Duration (s) |
|---|---|---|---|---|---|
| 1 | 58 | 0 | 3 | 0.0 | 39.1 |
| 2 | 61 | 4 | 5 | 0.5 | 51.9 |
| 3 | 64 | 100 | 5 | 2.0 | 80.3 |
| 4 | 69 | 266 | 5 | 3.5 | 116.9 |
| 5 | 76 | 129 | 10 | 2.0 | 108.2 |
| 6 | 91 | 215 | 10 | 4.0 | 139.9 |
| 7 | 107 | 106 | 10 | 4.0 | 62.8 |
| 8 | 120 | 160 | 10 | 4.0 | 77.4 |
| 9 | 133 | 625 | 10 | 5.0 | 166.4 |
| 10 | 152 | 233 | 12 | 5.0 | 165.4 |
| 11 | 163 | 383 | 12 | 5.0 | 130.9 |
| 12 | 174 | 450 | 10 | 4.3 | 169.5 |
| 13 | 193 | 210 | 8 | 3.3 | 160.5 |
| 14 | 241 | 2 | 5 | 0.5 | 23.0 |
| 15 | 254 | 407 | 12 | 5.0 | 128.8 |
| 16 | 268 | 116 | 10 | 1.5 | 107.9 |
| 17 | 282 | 187 | 10 | 2.5 | 116.8 |
| 18 | 292 | 230 | 10 | 2.5 | 124.3 |
| 19 | 345 | 63 | 10 | 1.0 | 99.8 |
| 20 | 362 | 391 | 10 | 4.4 | 130.3 |
| 21 | 375 | 370 | 10 | 3.85 | 129.2 |
| 22 | 384 | 68 | 10 | 1.0 | 101.4 |
| 23 | 388 | 358 | 10 | 4.0 | 129.1 |
| 24 | 398 | 47 | 10 | 1.45 | 69.5 |
| 25 | 403 | 704 | 10 | 5.5 | 161.3 |
| 26 | 414 | 360 | 8 | 3.8 | 159.0 |
| 27 | 418 | 307 | 10 | 3.0 | 152.9 |
| 28 | 423 | 418 | 10 | 3.6 | 152.4 |
| 29 | 465 | 179 | 10 | 5.5 | 66.6 |
| 30 | 533 | 2 | 5 | 0.5 | 33.3 |
| 31 | 550 | 97 | 10 | 4.75 | 55.6 |
| 32 | 561 | 94 | 10 | 4.75 | 55.3 |
| 33 | 567 | 111 | 10 | 4.75 | 55.2 |
| 34 | 625 | 0 | 5 | 0.0 | 18.3 |
| 35 | 635 | 15 | 14 | 3.0 | 52.0 |
| 36 | 642 | 110 | 10 | 5.5 | 60.5 |
| 37 | 649 | 62 | 10 | 3.0 | 55.2 |
| 38 | 667 | 111 | 10 | 3.5 | 74.3 |
| 39 | 673 | 140 | 10 | 4.0 | 78.7 |
| 40 | 681 | 178 | 10 | 3.2 | 91.6 |
| 41 | 689 | 183 | 10 | 3.0 | 109.1 |
| 42 | 697 | 248 | 10 | 3.0 | 137.2 |
| 43 | 708 | 390 | 12 | 4.0 | 146.0 |
| 44 | 711 | 334 | 12 | 3.5 | 141.3 |
| 45 | 714 | 496 | 12 | 6.0 | 144.5 |
| 46 | 717 | 445 | 12 | 5.3 | 135.9 |
| 47 | 729 | 440 | 12 | 5.3 | 146.1 |
| 48 | 741 | 398 | 12 | 4.65 | 149.9 |
| 49 | 752 | 282 | 16 | 6.5 | 142.7 |
| 50 | 763 | 322 | 18 | 4.6 | 145.7 |
| 51 | 772 | 188 | 12 | 4.0 | 136.9 |
| 52 | 776 | 363 | 12 | 3.7 | 145.0 |
| 53 | 860 | 143 | 5 | 2.5 | 74.9 |
| 54 | 872 | 0 | 5 | 0.0 | 24.4 |
| 55 | 881 | 264 | 10 | 4.7 | 142.9 |
| 56 | 894 | 410 | 12 | 5.3 | 140.9 |
| 57 | 902 | 217 | 10 | 3.0 | 128.6 |
| 58 | 910 | 174 | 10 | 3.0 | 106.8 |
| 59 | 915 | 0 | 20 | 0.0 | 142.6 |
| 60 | 924 | 340 | 16 | 8.0 | 132.8 |
| 61 | 933 | 0 | 24 | 0.0 | 129.5 |
| 62 | 940 | 268 | 18 | 10.0 | 121.1 |
| 63 | 947 | 579 | 12 | 6.3 | 142.6 |
| 64 | 954 | 411 | 12 | 5.8 | 139.1 |
| 65 | 960 | 7 | 10 | 1.0 | 48.0 |
| 66 | 961 | 1 | 3 | 1.0 | 23.0 |
| 67 | 990 | 393 | 12 | 5.3 | 135.9 |
| 68 | 1003 | 702 | 16 | 10.0 | 131.1 |
| 69 | 1007 | 705 | 16 | 10.0 | 135.4 |
| 70 | 1009 | 260 | 12 | 3.0 | 132.9 |
| 71 | 1024 | 0 | 12 | 7.0 | 35.0 |
| 72 | 1035 | 0 | 12 | 0.0 | 32.0 |
Sources
- NASA/JPL-Caltech: Ingenuity Helicopter Flight Log. All 72 rows; pp.1-4. Headers identify horizontal distance, maximum altitude, maximum groundspeed and duration. Footer specifies Pacific-date convention.
- JPL: The Most Extreme Flights of Ingenuity (January 31, 2024). January 31, 2024 description explicitly names altitude Flight 61 and speed Flights 62/68/69.
- NASA: Lucky 13, with the completed Flight 12 results. Confirms 450 m and 169.5 s for completed Flight 12; later Flight 13 numbers are plans and excluded.
- NASA: The Right Stuff, Ingenuity’s high-altitude and high-speed tests. Explains the 24 m Flight 61 hover and 10 m/s forward-flight campaign; useful to distinguish vertical and forward performance.
Charts and calculations: LaunchDetect, using the linked factual records. No NASA or JPL endorsement is implied.