Launch Watch · Current evidence
Published
EarthCARE’s volcanic plume: what the grey gap leaves unresolved
An audit of nine labels in ESA’s Anak Krakatau composite separates detected features, presumed ash and the region neither radar nor lidar resolves.
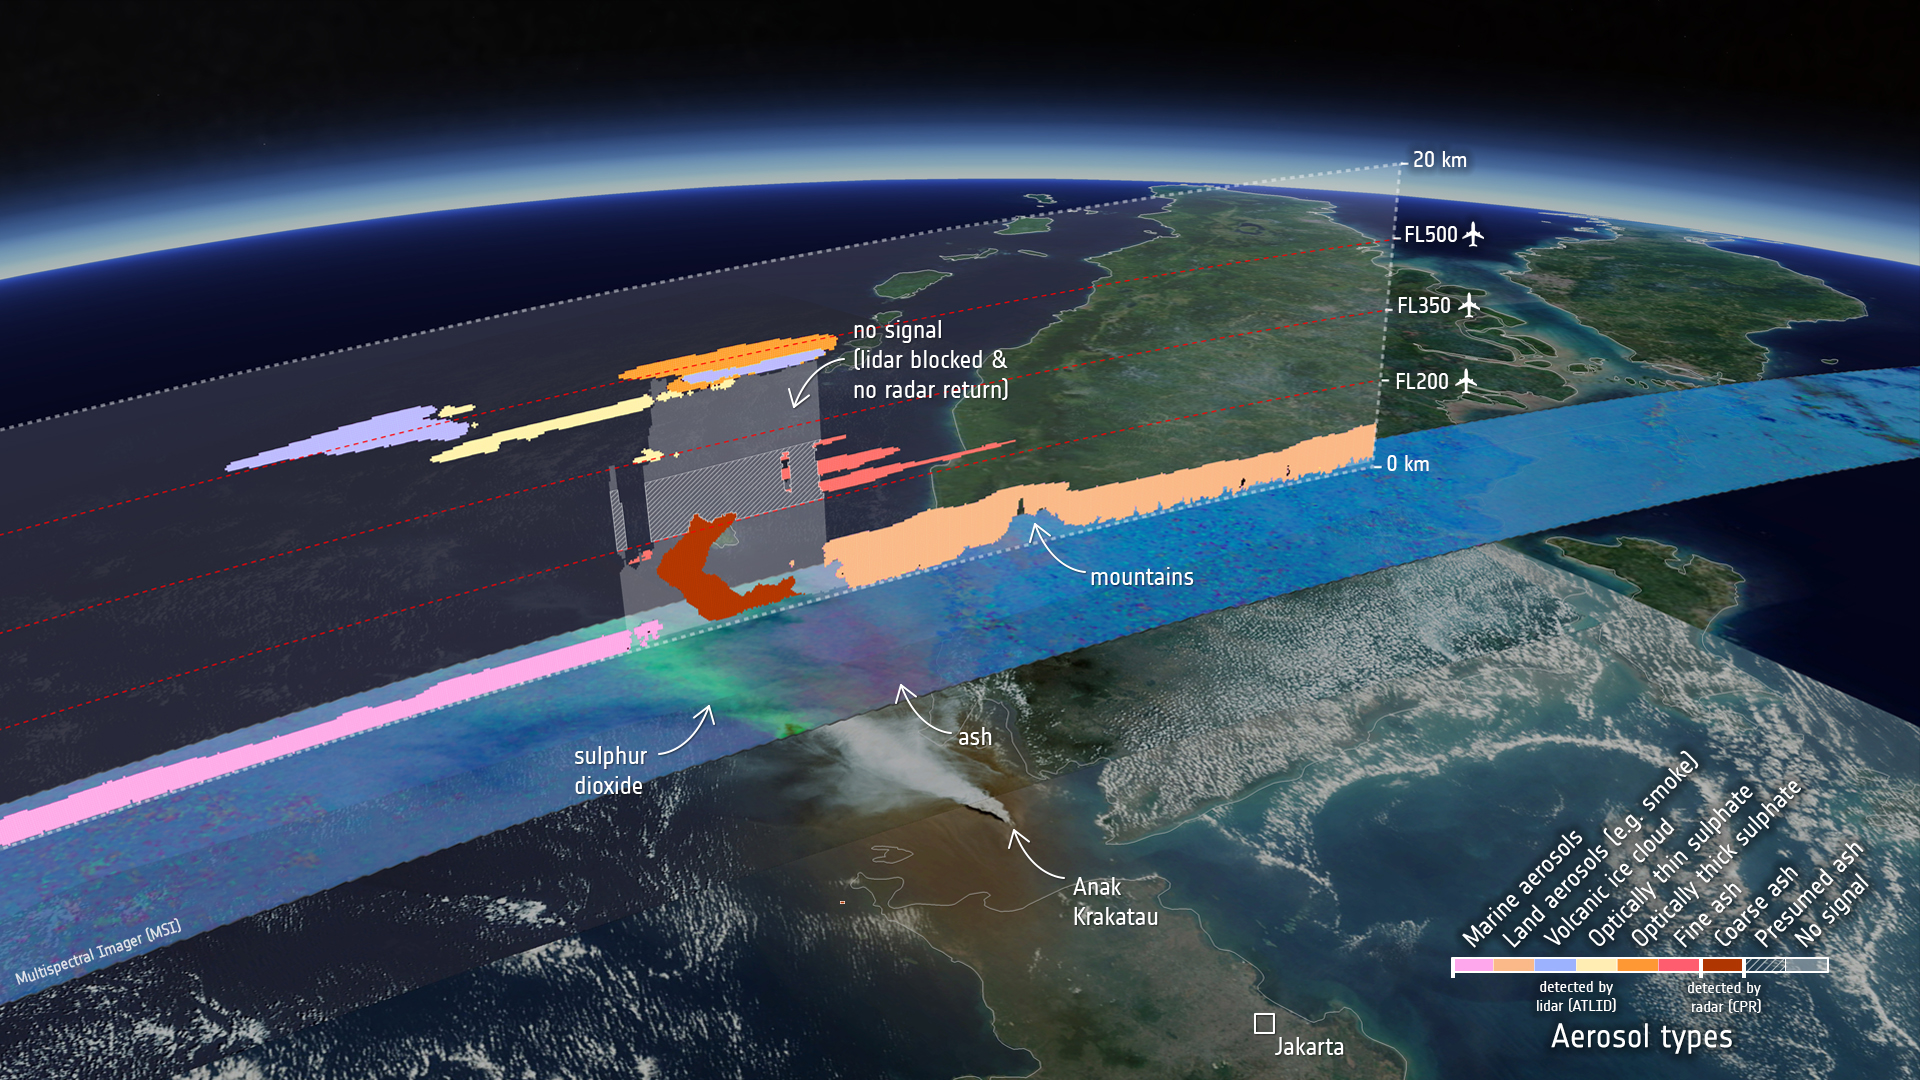
The most important part of ESA’s newly published EarthCARE volcanic-plume figure may be its grey gap. Beneath an optically thick sulfate layer, the figure explicitly marks a region where the lidar is blocked and the radar has no return. Combining the two sensors has exposed a limit in the evidence, rather than established that the air there is clear.
ESA published the Anak Krakatau analysis on 1 October 2026, describing an eruption that began on 4 September. The Sentinel-3 background in the composite is dated 5 September. The reviewed caption does not give exact EarthCARE granule timestamps, so the entire multisensor scene cannot be assigned a single synchronized acquisition time from this illustration alone.
We transcribed all nine legend states into an evidence register. Six are lidar classifications; one is a radar feature whose ash interpretation remains tentative; one marks presumed ash; and one marks no signal. Keeping those categories separate is the main result of this audit. This is a historical image interpretation, not a current aviation advisory.
Nine labels, four kinds of evidence
A legend can mix a retrieved category with an inference or an observation gap. Reading every colour as an equally direct measurement would erase the distinctions the source has deliberately drawn. The table reproduces the labels in text and adds our evidence-status interpretation; it is an editorial register, not new instrument data.
| Source label | Channel or encoding | What the label supports |
|---|---|---|
| Marine aerosols | ATLID; pink | Provider aerosol classification; no salt concentration measured here |
| Land aerosols (e.g. smoke) | ATLID; peach | Land-aerosol classification; smoke is a possible interpretation |
| Volcanic ice cloud | ATLID; pale lavender | Provider cloud classification; no ice mass inferred here |
| Optically thin sulphate | ATLID; pale yellow | Provider optical classification, not a chemical sample |
| Optically thick sulphate | ATLID; orange | Classified upper layer with attenuation of the lidar below |
| Fine ash | ATLID; coral red | Provider fine-ash classification; no size distribution recovered here |
| Coarse ash | CPR; dark brown | Radar return; possible ash aggregates require confirmation |
| Presumed ash | Diagonal hatching | Explicit inference, separate from measured classifications |
| No signal | Grey | Lidar blocked and no radar return; composition unresolved |
Download the nine-row evidence register, including source links, vertical context and the inference each row should not be used to make.
Reading one: “the grey volume is clear air”
The source annotation gives two reasons this conclusion fails. The laser signal is attenuated by the layer above, while the radar supplies no return from the same depicted region. A lack of return under those conditions does not establish a zero particle concentration. It leaves an unresolved part of the profile.
It is tempting to treat two missing measurements as two independent votes for absence. Here their meaning depends on each instrument’s response and the material between it and the target. The correct register entry is “unresolved with this instrument pair,” with the stated causes retained. It would be misleading to fill that region using the category immediately above, below or beside it.
Our missing-value and measured-zero guide covers the broader data distinction. The EarthCARE case supplies a concrete physical mechanism: an attenuated optical path and no radar return beneath a classified upper layer.
Reading two: “the hatching is another measured class”
The diagonal pattern is labelled presumed ash. That wording carries information. It marks an inference within the obscured region, rather than another category equivalent to the nearby fine-ash classification. Removing the word “presumed,” or recolouring the whole area as detected ash, would strengthen the claim beyond its source.
This distinction should survive export into a map, table or alert feed. A useful record can preserve both the hypothesized material and its evidence state. A simplified field that accepts only an aerosol name would lose the difference between the plotted inference and the sensor-based classifications.
Reading three: “the radar proves the particle composition”
The dark-brown feature is different from the grey gap: a radar return exists. ESA describes a feature from the surface to around six kilometres and discusses possible larger ash aggregates roughly 200 kilometres from the volcano. The provider says that interpretation needs confirmation. Those distances are reported approximations, not measurements we extracted from the JPEG.
There are therefore two separate uncertainties in this one figure. For the dark-brown feature, the unresolved question is what produced an observed return. For the grey region, the pair supplies no usable return of the kind shown. A single generic “uncertain” flag would be less helpful than preserving those two reasons.
Different wavelengths, different response
The CPR radar specification gives 94 gigahertz, while ATLID uses 355-nanometre ultraviolet light. Dividing the defined speed of light by the radar frequency gives a vacuum wavelength of 3.189 millimetres. Converting both wavelengths to the same units gives a ratio of about 8,984.
| Quantity | Value | Interpretation |
|---|---|---|
| CPR frequency | 94 GHz | Published radar frequency |
| CPR vacuum wavelength | 3.189 mm | 299,792,458 m/s ÷ 94,000,000,000 /s |
| ATLID wavelength | 355 nm | Published ultraviolet wavelength |
| Wavelength ratio | About 8,984 to 1 | Wavelengths only; not a sensitivity or penetration ratio |
The large ratio helps show how different the electromagnetic probes are. It does not tell us that the radar sees 8,984 times farther, detects that many more particles, or is universally better. ESA’s instrument descriptions instead explain complementary responses: the radar responds comparatively well to larger particles, while lidar can reveal fine aerosol and can be extinguished by an optically thick layer. The actual grey region shows why complementary instruments can still leave an unresolved volume.
Method and limits: read the figure without turning it into a data grid
We inspected the original 1,920 × 1,080 JPEG, transcribed the legend labels and kept the source’s uncertainty terms. We checked the wavelength conversion independently and recorded the inputs and units in a numerical-check CSV. We did not digitize layer boundaries, ash mass or particle concentrations from the perspective rendering.
The displayed flight levels also need their own convention. Under the FAA definition, a flight level is a standard-pressure level expressed in hundreds of feet. FL200, FL350 and FL500 correspond to nominal pressure-altimeter values of 20,000, 35,000 and 50,000 feet. Their simple unit conversions are 6.096, 10.668 and 15.240 kilometres, respectively. These are not independently measured geometric layer heights or a basis for collocating a particular aircraft with a coloured pixel.
The file’s width describes an editorial asset, not a sensor ground resolution. Its embedded 24 September editing/export timestamp, which has no timezone, likewise cannot supply a missing observation time. The composite is valuable for understanding the provider’s interpretation; it is insufficient for repeating the retrieval from raw measurements.
What would make the interpretation reproducible from data?
The next step would require the exact EarthCARE product identifiers and UTC times, profile coordinates, optical and radar measurements, retrieval-quality flags and aerosol-classification version. With those records, an analyst could test the classification and collocation at the data level. Without them, the accurate contribution here is the nine-state evidence audit, with the unknowns preserved.
The figure’s aviation relevance comes from the provider’s reported use of vertical information during a past eruption. It supplies no present clearance for a route or altitude. Its lasting value for satellite analysis is more specific: detected return, inferred material and unsounded volume can coexist in the same attractive multisensor image.
Sources and current-interest context
- ESA: EarthCARE’s view of volcanic plume boosts air safety, 1 October 2026.
- ESA: EarthCARE distinguishes volcanic aerosols, source figure, legend and licence.
- ESA ATLID specifications and CPR specifications.
- FAA flight-level definition and BIPM definition using the speed of light.
ESA featured the story in its In the spotlight section at the 4 October 2026, 20:04 UTC check; the site displayed 1,007 cumulative views and 25 likes. This is a publisher-local editorial and engagement signal within the past week. It establishes neither a global trend nor measured clicks, search demand or growth rate.