Launch Watch · Satellite
Published
GOES pixel area: why a “2 km” cell covers 5.10 km² at Cape Canaveral
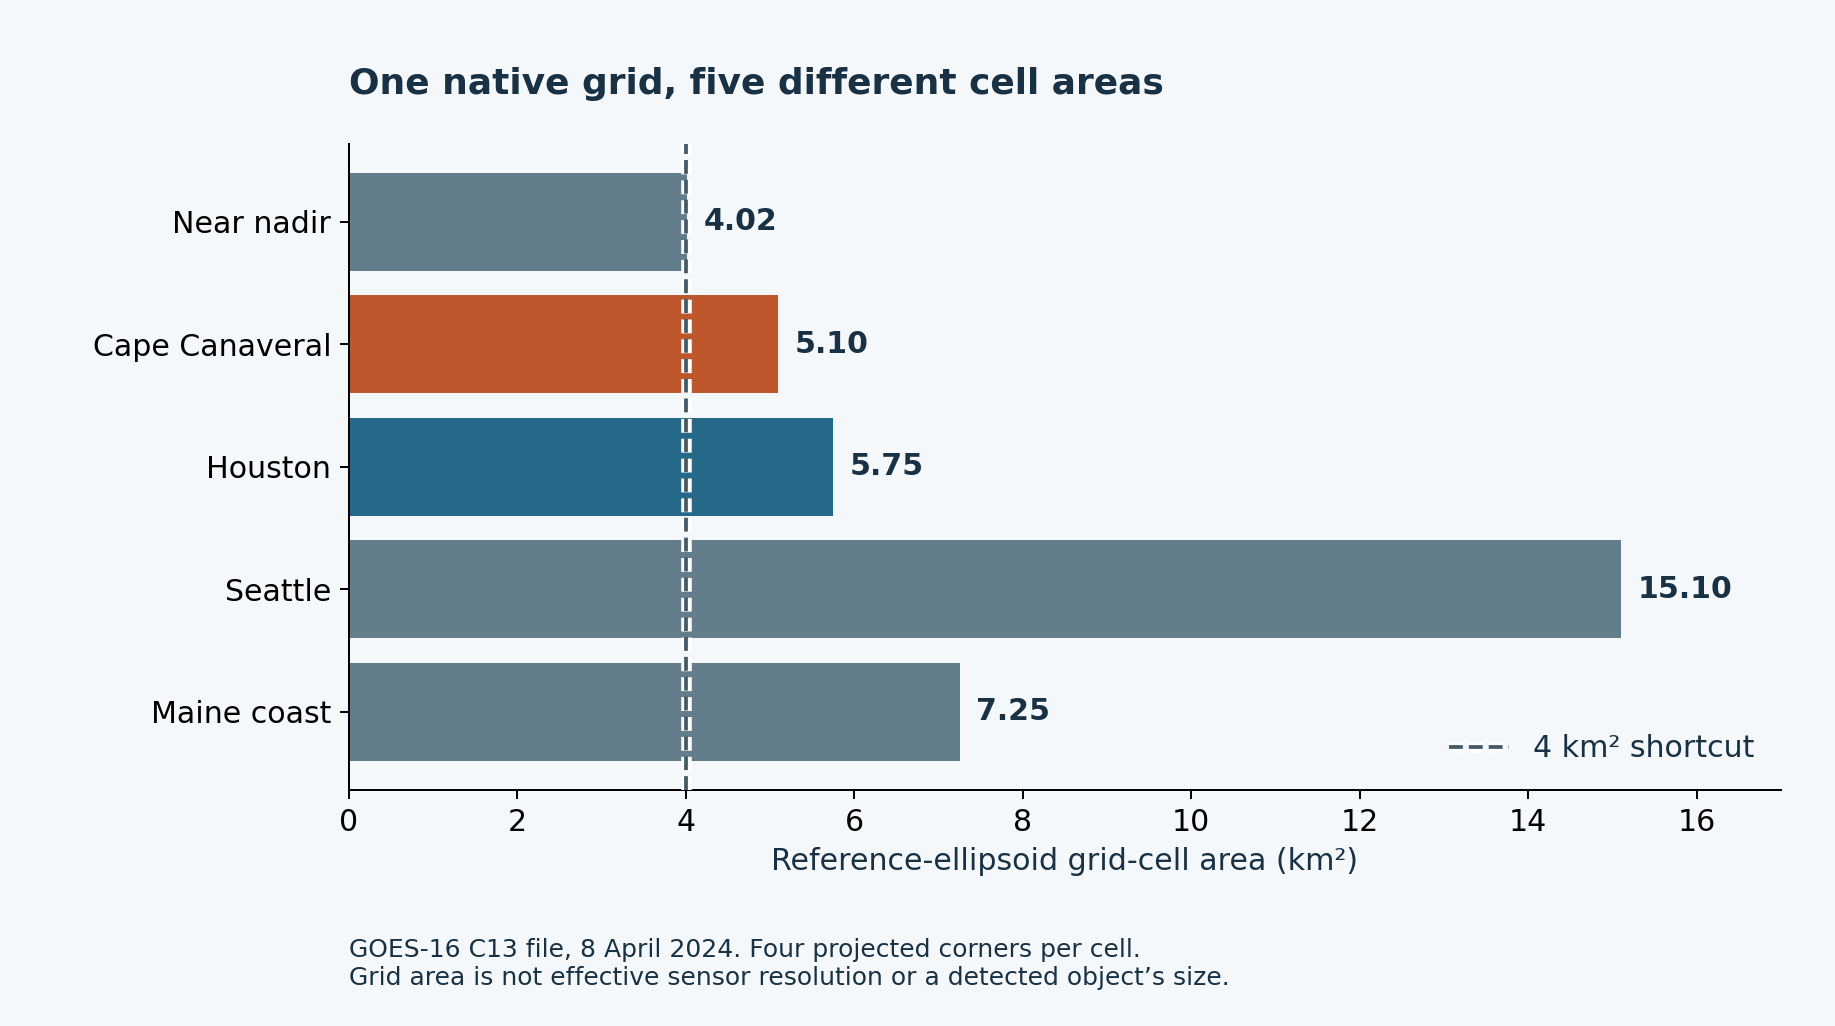
Reproduce a five-location GOES-16 grid test: the Cape Canaveral cell covers 5.10 km², while Seattle’s covers 15.10 km². Grid area is not resolution.
The native GOES-16 Band 13 cell nearest Cape Canaveral in our test covers about 5.10 km² on the reference ellipsoid. Multiplying one nominal “2 km” pixel by 2 km gives 4 km², which is about 21.5% below this calculated cell area. Near Seattle, the same file’s selected cell covers about 15.10 km².
These numbers come from the actual stored scan-angle grid in one historical NOAA file. They answer a narrow question: how much surface area does a particular grid cell represent? They do not measure the sensor’s effective spatial resolution, a fire’s area or a plume’s size.
The five-location result
| Target location | Target lon, lat (°) | Zero-based row, column | Cell area (km²) | Multiple of 4 km² |
|---|---|---|---|---|
| Near nadir | -75.0000, 0.0000 | 2711, 2711 | 4.0161 | 1.004× |
| Cape Canaveral | -80.6043, 28.6084 | 1233, 2445 | 5.0950 | 1.274× |
| Houston | -95.3698, 29.7604 | 1195, 1784 | 5.7479 | 1.437× |
| Seattle | -122.3321, 47.6062 | 589, 1283 | 15.0979 | 3.774× |
| Maine coast | -68.2000, 44.4000 | 614, 2966 | 7.2501 | 1.813× |
“Near” matters: the target coordinate selects the nearest cell center in the native scan-angle coordinates. It is not a claim that a named city is a single pixel. For Cape Canaveral, the selected center is approximately 80.6117° W, 28.6122° N; the requested target is 80.6043° W, 28.6084° N.
There are two legitimate percentage comparisons here, with different denominators. The Cape cell is 27.4% larger than 4 km². Conversely, using 4 km² understates its computed area by 21.5%. Saying merely “a 27% area error” would hide that distinction.
Why the file’s “2 km” label is not a universal area
The source netCDF is GOES-16 ABI Level 2 cloud and moisture imagery, full disk, Band 13, from 8 April 2024. Its metadata labels the spatial resolution “2km at nadir.” The x and y axes each contain 5,424 samples with an absolute scan-angle step of approximately 0.000056 radians.
Equal angular steps do not carve the curved Earth into equal-area squares. The geostationary view becomes more oblique away from the subsatellite region, so the surface intersections stretch and skew. NOAA’s fixed-grid navigation documentation explains how the scan angles and projection parameters locate those intersections.
The near-nadir result is 4.0161 km², rather than exactly 4.0000. The nominal label is rounded; the calculation uses the stored grid spacing and ellipsoid. At Cape Canaveral, the four geodesic edge lengths are approximately 2.0705, 2.4659, 2.0706 and 2.4660 km. The cell is not a 2-by-2 km ground square.
How to reproduce the area calculation
- Decode the stored coordinates. Read the packed integer x and y axes, then apply each axis’s stored scale factor and offset in floating-point arithmetic. Do not apply those factors twice if your netCDF reader already unpacks them.
- Use this file’s projection. The longitude of projection origin is −75°, the perspective-point height is 35,786,023 m, and the ellipsoid semi-axes are 6,378,137 m and 6,356,752.31414 m. These are the historical file’s values.
- Select a cell and locate four corners. Transform the target to the native grid, choose the nearest coordinate on each axis, and offset the center by half a scan-angle step in each direction.
- Intersect the corner rays with the ellipsoid. We independently implemented NOAA’s navigation equations and checked every resulting corner against PROJ’s geostationary inverse transform.
- Measure the polygon. Join the four ground corners with short geodesic edges on that same ellipsoid and calculate the enclosed area. The full-precision result is in square metres before conversion to km².
The two navigation implementations agree to better than 0.0000001° at every tested corner. That is a computational consistency check, not a statement about the satellite’s actual navigation accuracy. The four-edge polygon is also an approximation to the continuously projected cell boundary; we do not extend this small-cell method blindly to the Earth’s limb.
Download the inputs and repeat the geometry test
The 5,424-row coordinate extract (CSV) retains both packed one-dimensional axes, each stored scale factor and offset, and their decoded angles. The five-cell result (CSV) gives target and selected-center locations, indices, areas and ratios. The 20-corner extract (CSV) provides the individual geographic corners and edge lengths.
Apply the navigation equations linked above with the stated source ellipsoid and projection parameters, then calculate each corner polygon’s geodesic area. These static inputs make every displayed value inspectable without JavaScript. The source file is OR_ABI-L2-CMIPF-M6C13_G16_s20240991800204_e20240991809524_c20240991810005.nc. Only coordinates and projection metadata enter this calculation; no Band 13 brightness temperatures are analyzed.
When this area is useful, and when it is not
If a mapped surface mask marks complete native cells, a sum of their individual surface areas is a more defensible geometric denominator than a pixel count multiplied by 4 km². An actual application still needs to decide how to handle partially covered cells, missing observations and the meaning of the mask. Do not multiply all marked cells by the single Cape value either: compute the area at each location.
A thermal detection is a different problem. A hot source may occupy only part of a cell, and the instrument’s spatial response is not established by the spacing between grid coordinates. Elevated clouds or plumes also do not lie on the zero-height reference ellipsoid. These five results provide no correction for their height, optical spreading or terrain.
For a different satellite, band, sector, grid spacing or reprojected image, return to that product’s own coordinates. The April 2024 acquisition date identifies our geometry input; this is not an eclipse-observation claim. The practical rule is simple: use the actual grid to calculate grid area, and keep that quantity separate from resolution and object size.
Sources and data-use note
- NOAA GOES-16 C13 netCDF used in this test: packed axes, projection fields and nominal nadir label.
- NOAA STAR fixed-grid navigation explanation: geometric method.
- NOAA GOES NODD distribution entry: public-use terms and attribution requirements.
Sources checked 4 October 2026. The public distribution entry permits use of the data and requires care not to imply NOAA endorsement or present modified data as unaltered. The operational file also carries an older access-restriction string; our rights review retains that discrepancy and relies on the explicit public NODD distribution terms. No NOAA logo, source figure or third-party image is reproduced.