Launch Watch · Current evidence
Published
Why the biggest temperature anomaly gets a smaller weight
Reconstruct the 2023 GISTEMP global anomaly from eight latitude bands. Compare area-weighted terms with an unweighted mean and inspect the exact fractions.
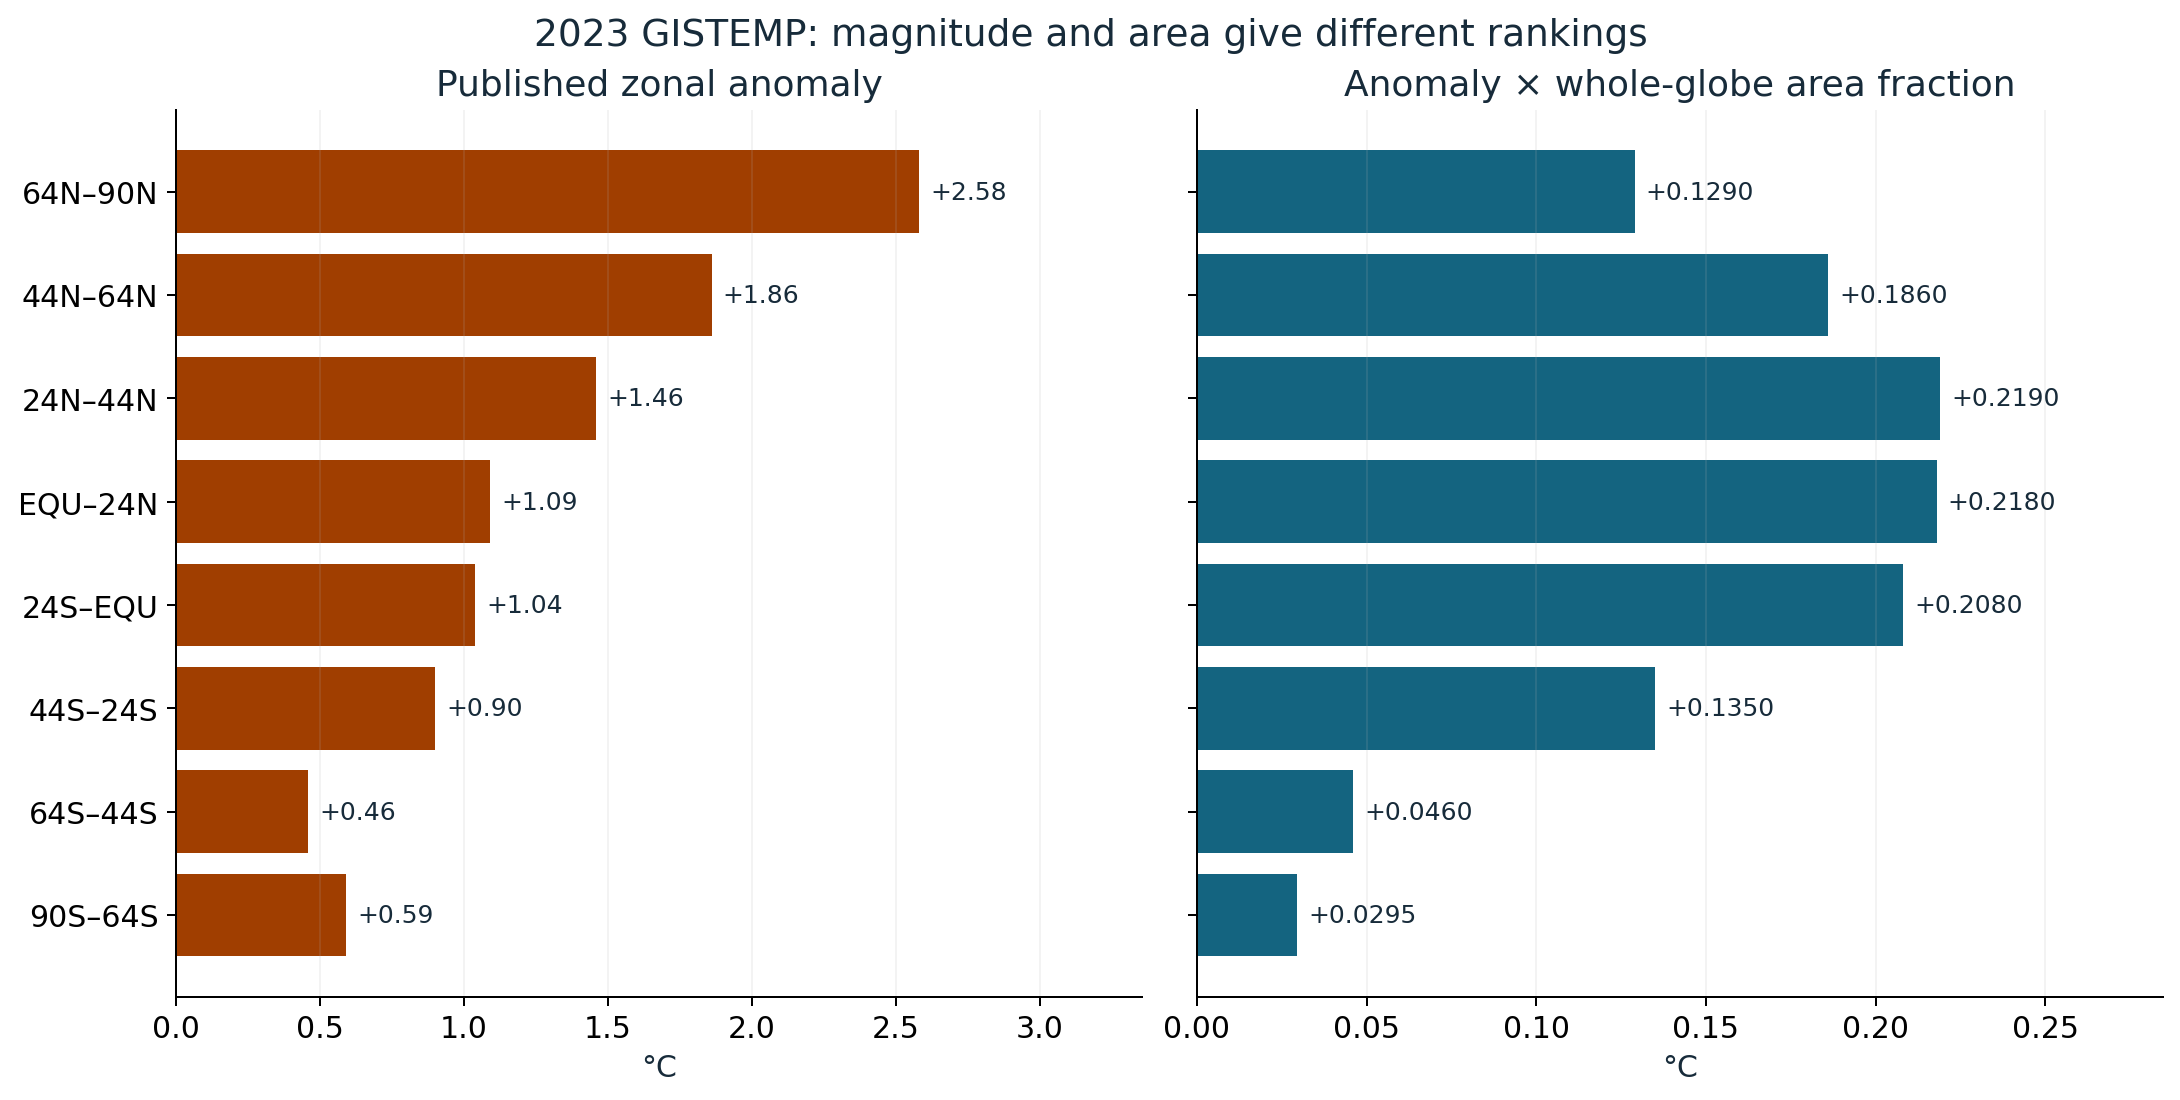
In the published 2023 GISTEMP latitude-band table, the northern polar band has an anomaly of +2.58°C, while the band from the equator to roughly 24°N has +1.09°C. Yet the tropical band contributes the larger term to an area-weighted reconstruction of the global average: +0.218°C versus +0.129°C.
The reason is area. The northern tropical band represents 20% of the globe in the documented band scheme, while the northern polar band represents 5%. Four times the area more than offsets its smaller temperature anomaly in this arithmetic example.
Build the average from all eight terms
The annual zonal table supplies the 2023 values below. We retain its printed band labels and combine the eight non-overlapping latitude bands with their documented area fractions.
| Printed band | Anomaly | Global-area fraction | Weighted term |
|---|---|---|---|
| 64°N–90°N | +2.58°C | 0.05 | +0.1290°C |
| 44°N–64°N | +1.86°C | 0.10 | +0.1860°C |
| 24°N–44°N | +1.46°C | 0.15 | +0.2190°C |
| Equator–24°N | +1.09°C | 0.20 | +0.2180°C |
| 24°S–equator | +1.04°C | 0.20 | +0.2080°C |
| 44°S–24°S | +0.90°C | 0.15 | +0.1350°C |
| 64°S–44°S | +0.46°C | 0.10 | +0.0460°C |
| 90°S–64°S | +0.59°C | 0.05 | +0.0295°C |
The fractions sum to 1.00. Adding the eight weighted terms gives 1.1705°C, which rounds to 1.17°C, matching the global field in the retrieved 2023 table at its published precision.
The units remain degrees Celsius because each weight is a dimensionless area fraction. A weighted term is a component of this numerical average. It is not an amount of heat, an emissions contribution or a measure of which region is causally responsible for warming elsewhere.
What goes wrong with a simple eight-number mean?
The ordinary, unweighted mean of the eight anomalies is 1.2475°C. That operation gives every band a weight of one-eighth, or 12.5% of the total, regardless of how much of Earth it represents.
For the northern polar band, 12.5% is much larger than its documented 5% area fraction. For the northern tropical band, 12.5% is smaller than its 20% fraction. The naive average therefore changes the geographic weighting before any arithmetic error occurs.
In this row, the unweighted result exceeds the weighted reconstruction by 0.0770°C. That difference illustrates the aggregation choice for these eight values; it is not a universal correction to apply to other years or datasets.
Why the fractions are 0.20, 0.15, 0.10 and 0.05
The GISTEMP source documentation’s zonal-grid explanation gives boundaries whose latitude sines are 0, 0.4, 0.7, 0.9 and 1 in each hemisphere. These divide a hemisphere into bands with area proportions 4:3:2:1 from equator to pole.
A hemisphere is half the globe, so those proportions become global fractions of 0.20, 0.15, 0.10 and 0.05. The same fractions apply in reverse order from the South Pole toward the equator. This is why eight bands do not imply eight equal areas.
The familiar 24°, 44° and 64° labels are rounded. The documented boundaries are approximately 23.6°, 44.4° and 64.2°. Recalculating weights from the rounded labels would introduce a small discrepancy from the documented scheme. We use the stated fractions instead.
The detailed grid explanation is archived under the v3 source-documentation path. We cite it specifically for the long-standing band geometry, not as a claim that its full source-code description is the present v4 processing pipeline. The current FAQ explains the construction of zonal and regional means and their area weighting.
Retain the baseline and the product definition
These values are anomalies relative to the 1951–1980 reference period, as documented in the GISTEMP materials. A +2.58°C anomaly does not say that the northern polar band’s absolute temperature was 2.58°C. It describes a departure from its reference within the analysis.
The GISTEMP overview identifies a surface-temperature analysis drawing on land-station and ocean-temperature records. The result is not a reading from one global satellite thermometer. The zonal table is already a processed summary before we begin multiplying its columns.
Keeping the baseline fixed is important when comparing this worked example with another source. A different reference period changes anomaly values. It does not make an unlabeled combination of those anomalies meaningful just because the numbers all use °C.
What this reconstruction verifies
This calculation checks the arithmetic of combining rounded published summaries. It does not rerun station merging, homogenization, spatial interpolation, missing-data treatment or the complete production index. Agreement after rounding is useful, but it is not an independent reconstruction of the global climate record from raw observations.
The GISTEMP FAQ also explains that map-based means and index-file means can differ slightly because missing data are handled differently. Its guidance treats the index-file result as definitive. Our worked table therefore points back to the official global field instead of presenting a competing four-decimal “true” global estimate.
Repeat the eight-row calculation
Download the eight values, fractions and weighted terms. In a spreadsheet, multiply each anomaly by the adjacent area fraction and sum the products. Separately, check that the fractions add to one and calculate an unweighted mean if you want to see the effect of the weighting choice.
Use the eight narrow-band columns rather than mixing them with the table’s global, hemispheric or broad tropical columns, which overlap them. Select the same annual row and retain the reference period. Those checks prevent double-counting and mismatched comparisons.
Source credit: GISTEMP Team (2024), GISS Surface Temperature Analysis, version 4, NASA Goddard Institute for Space Studies, accessed 5 October 2026; see the provider’s citation and analysis references. This AI-assisted explanation and original graphics are LaunchDetect work. NASA has not reviewed or endorsed the interpretation and is not responsible for it. No trend attribution or new record ranking is claimed.