Launch Watch · Current evidence
Published
Hilo and Honolulu solar data: similar years, different peaks
Compare 2024 NASA POWER monthly grid-cell estimates, all-sky versus clear-sky ratios and day-weighted energy totals for two Hawaii coordinates.
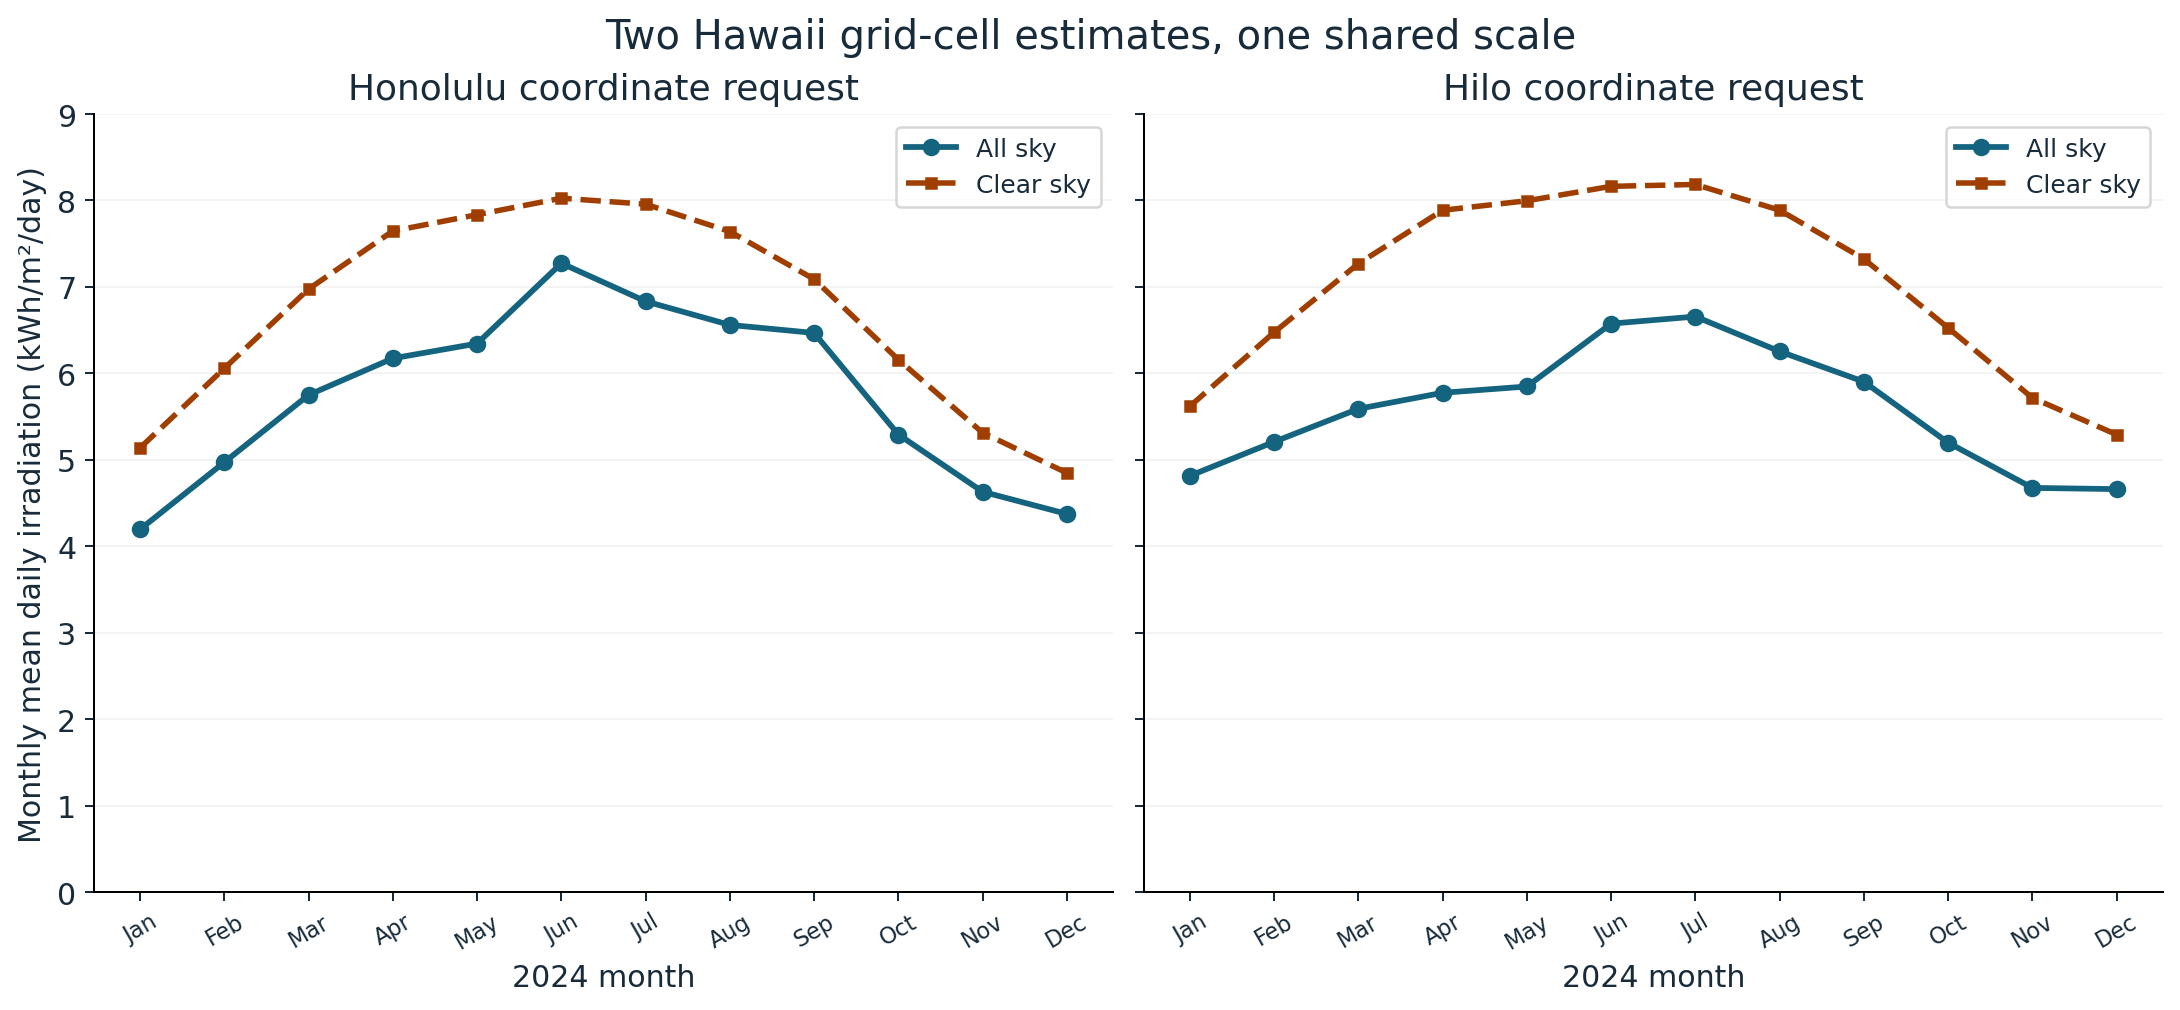
Two 2024 NASA POWER requests for coordinates in Honolulu and Hilo return fairly close annual all-sky solar values: 5.7396 and 5.5982 kilowatt-hours per square metre per day. Yet the monthly patterns differ. The Honolulu-request series reaches its highest daily mean in June; the Hilo-request series peaks in July.
Those numbers describe the source grid cells serving the two coordinate requests. They are not rooftop measurements or averages over each municipality. Still, putting the twelve months beside the annual fields reveals useful information that a single annual number hides.
Start with a matched pair of requests
We used the same year, renewable-energy community and two parameters for both requests: ALLSKY_SFC_SW_DWN and CLRSKY_SFC_SW_DWN. The requested coordinates were 21.3069°N, 157.8583°W for Honolulu and 19.7297°N, 155.09°W for Hilo. The linked Honolulu response and Hilo response expose the exact inputs and output fields.
| Measure | Honolulu request | Hilo request |
|---|---|---|
| Provider’s annual daily mean | 5.7396 kWh/m²/day | 5.5982 kWh/m²/day |
| Highest monthly daily mean | 7.2739 in June | 6.6576 in July |
| Lowest all-sky / clear-sky ratio | 0.8074 in April | 0.7314 in May |
| Sum of monthly means × days | ≈2,100.71 kWh/m² | ≈2,048.92 kWh/m² |
The annual daily means differ by 0.1414 kWh/m²/day. That is a compact comparison of the whole year, but it cannot say when the strongest month occurred or when the all-sky series diverged most, proportionally, from the clear-sky series. Those are separate questions answered by the monthly rows.
The API units matter. A monthly value in kWh/m²/day is an average amount of daily energy received per square metre over that month. It is not an instantaneous W/m² reading or the total energy for the month. Keeping “per day” in the label prevents an easy factor-of-thirty mistake.
Use the all-sky / clear-sky ratio carefully
For the Hilo request in May, the all-sky value is 5.8488 and the clear-sky value is 7.9966 kWh/m²/day. Dividing the first by the second gives 0.7314, or about 73.14%. This is the smallest monthly ratio in that request’s 2024 series.
The Honolulu request’s smallest ratio occurs a month earlier: 6.1742 ÷ 7.6469 = 0.8074 in April. The two examples show why the lowest ratio and the highest available solar energy need not occur in the same month. A ratio compares two values within one month; the all-sky peak compares absolute daily energy across months.
Use the ratio as a comparison between these two model-derived quantities. It is not the fraction of sky covered by cloud, the percentage of hours with sunshine, or a solar panel’s efficiency. The calculation contains no observed cloud-cover fraction and no panel-performance information.
Turn a daily mean into a monthly energy estimate
The Honolulu-request June value is 7.2739 kWh/m²/day. Multiplying by June’s 30 days gives 218.217 kWh/m². The Hilo-request July value is 6.6576; multiplying by 31 gives 206.3856 kWh/m². These are integrated horizontal-surface energy estimates derived from the rounded monthly means.
Apply that operation to all twelve months and add the results. Because 2024 is a leap year, February contributes 29 days and the year contains 366 days. The totals are 2,100.7148 kWh/m² for the Honolulu request and 2,048.9168 for the Hilo request, reported above to two decimals.
The provider also supplies an annual field, identified by the month-like key 202413. Keep that separate from the twelve calendar months. Including it as a thirteenth month would double-count information. Conversely, a simple average of the twelve monthly means would give February the same weight as a 31-day month.
The month-sum calculation and the annual field use rounded outputs. We do not require an exact identity between them or treat the extra arithmetic digits as new measurement precision. The reader CSV preserves the source monthly values and the day weights so both choices remain inspectable.
What the coordinate request can resolve
The POWER energy-flux methodology describes satellite observations combined with radiative-transfer calculations to estimate surface radiation. For this period, the API identifies CERES SYN1deg; the documented solar source grid is 1° latitude by 1° longitude. A point-shaped request does not change that native spatial support.
That limitation is especially important when a city name stands in for a coordinate in varied terrain. The POWER data FAQ explains that grid-representative elevation can differ substantially from a local site in mountainous areas. It would be unsafe to use these two cells alone to diagnose Hilo’s local cloud climate or rank individual rooftops.
A single year is another boundary. These 2024 values describe that year’s monthly estimates. They are not a multi-decade climatology, a forecast or evidence of a trend. The close annual values are a result of this matched comparison, not a general rule that the two cities have equivalent solar resources.
A useful next step for site-specific work
Before applying a grid comparison to a particular property, verify which source cell represents it, inspect the terrain represented in that cell and seek a suitable local measured record where available. An electricity estimate would additionally need panel orientation, roof shading, system efficiency and losses. None of those is modeled here.
Download all 24 location-month rows. Each row includes the day count, all-sky and clear-sky daily means, their ratio and the derived monthly energy. To repeat the calculation, request both parameters for the same year and community, check the returned units and missing-value marker, retain months 01–12, and keep the annual field separate.
Source credit: NASA POWER and CERES SYN1deg; responses retrieved on 5 October 2026. This AI-assisted article, calculations and graphics are original LaunchDetect work. NASA has not reviewed or endorsed the interpretation and is not responsible for it. All results are historical grid-cell estimates, with no third-party imagery reproduced.