Launch Watch · Spaceflight
Published
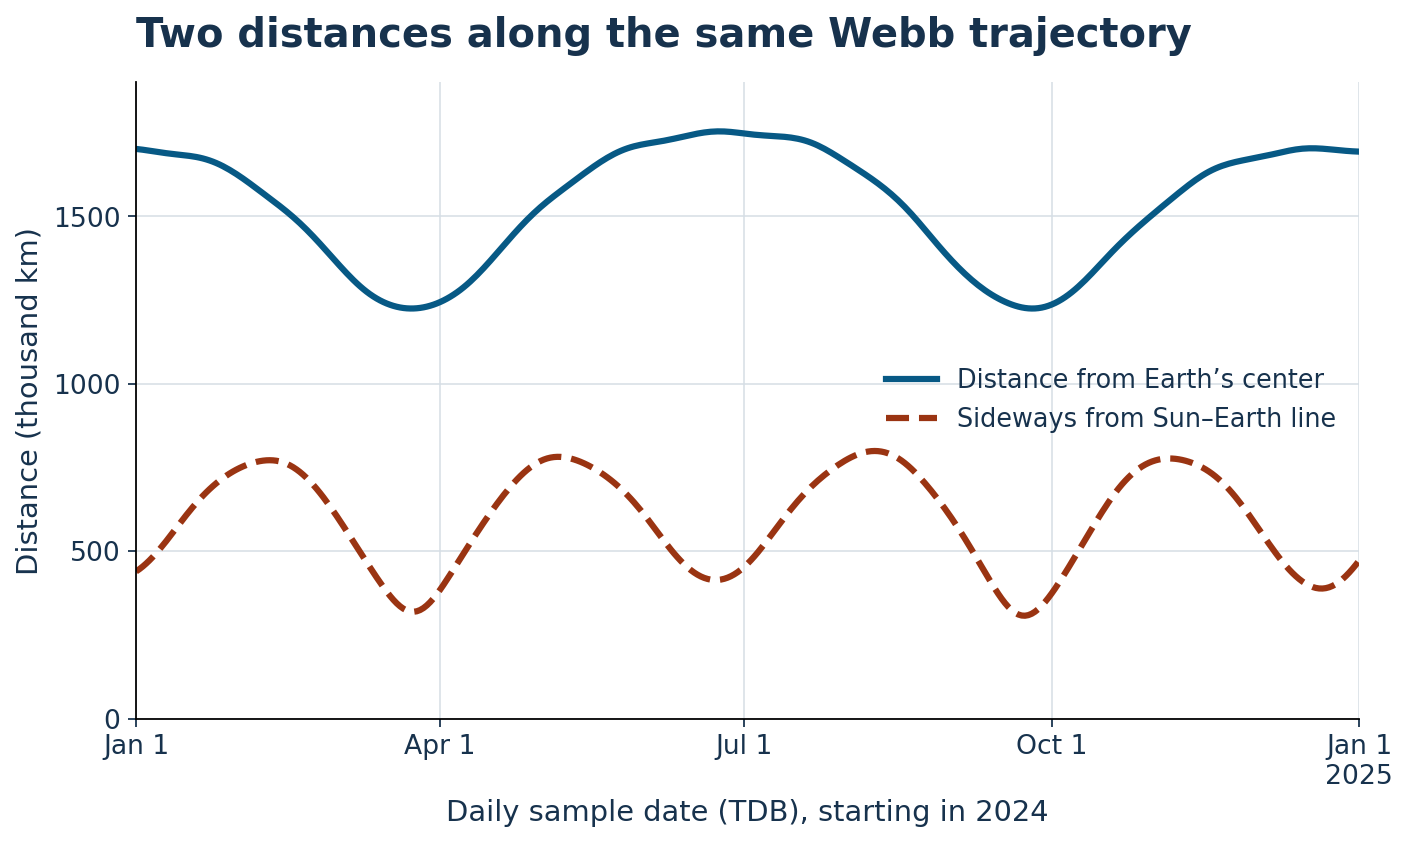
Webb’s 2024 path stayed 307,000 to 799,000 km off the Sun–Earth line
Project reconstructed Webb and Sun vectors onto a shared axis to measure sideways distance, with 367 daily samples and clear limits on what the geometry shows.
Webb is often drawn beside a point called L2 on a Sun–Earth diagram. A year of trajectory data reveals the scale hidden by that simple picture: in the daily samples covering 2024, the telescope was 307,065 to 798,939 kilometers sideways from the Sun–Earth line.
We calculated that perpendicular distance using Earth-centered Webb and Sun vectors from JPL Horizons. The same samples put Webb 1.224 to 1.753 million kilometers from Earth’s center. Those two ranges measure different pieces of the geometry.
Use the reconstructed trajectory, then state the frame
The retained Webb ephemeris identifies the 2024 interval as part of Goddard Flight Dynamics Facility’s definitive reconstructed trajectory, based on tracking data. That matters: this calculation uses reconstructed, as-flown trajectory solutions for the period, rather than a schematic halo drawn for illustration.
Both requests use Earth’s center as the origin, the J2000 ecliptic reference frame and geometric Cartesian positions in kilometers. The two series have matching daily epochs. Their timestamps use TDB, the time scale named in the ephemeris, and are not relabeled UTC.
There are 367 samples: January 1, 2024 through January 1, 2025, inclusive. The final point is an endpoint included to close the plotted year. The requested daily sampling does not establish the exact time or size of a continuous trajectory’s extrema.
| Quantity | Sample date (00:00 TDB) | Distance (km) |
|---|---|---|
| Smallest off-axis distance | 23 Sep 2024 | 307,065 |
| Largest off-axis distance | 9 Aug 2024 | 798,939 |
| Smallest Earth-center distance | 25 Sep 2024 | 1,224,354 |
| Largest Earth-center distance | 24 Jun 2024 | 1,753,273 |
How to measure “sideways” when the line keeps turning
At each epoch, take the Earth-to-Sun vector and reverse its direction. Normalize it to length one. That gives an anti-sunward axis pointing away from the Sun through Earth. The axis is rebuilt for each sample because a single fixed direction would not follow the Sun–Earth line through the year.
Next, project the Earth-to-Webb vector onto that axis. The projection gives the distance along the line. Subtract that along-axis vector from the original Webb vector; the length of what remains is the perpendicular, or sideways, distance.
The three lengths form a right triangle. In plain arithmetic: Earth distance squared = along-axis distance squared + sideways distance squared. We independently checked the sideways result with a cross-product calculation, which gives the same distance to the line.
For example, the August 9 sample has an Earth-center distance of about 1,605,074 km, an anti-sunward component of 1,392,105 km and a sideways component of 798,939 km. The sideways component is part of the Earth-to-Webb displacement, so adding it directly to the Earth distance would count geometry incorrectly.
A distance to a line is not a distance to L2
NASA’s Webb orbit explanation describes the observatory’s orbit around the Sun–Earth L2 region. Our calculation does not solve for the L2 point’s location. It therefore cannot turn the plotted perpendicular offset into an “L2 orbital radius.”
Likewise, the largest sideways distance occurs on August 9 in these samples, while the largest Earth-center distance occurs on June 24. The two maxima should not be combined as though they belonged to a single spacecraft position.
These positions alone do not establish orbit stability, eclipse avoidance, remaining fuel or mission lifetime. Those questions need additional models and operational evidence. The claim supported here is narrower and inspectable: how far Webb’s reconstructed position lay from a clearly defined moving line.
Download and reproduce the projection
The 367-row calculation CSV supplies the Julian date in TDB, the source calendar label, Earth-center distance, anti-sunward component, perpendicular distance and angle from the anti-sunward direction.
To regenerate it, obtain matching Horizons vector tables for Webb, target −170, and the Sun, target 10, centered on Earth, 500@399. Use geometric vectors without aberration correction, the J2000 ecliptic frame, kilometer–second units and one-day steps across the stated interval. Match epochs before applying the projection.
The source outputs were retained on October 5, 2026. Later trajectory revisions can change a freshly requested result. Preserve the response and its headers when repeating the analysis; the frame, origin, time scale and reconstructed-versus-predicted coverage are part of the evidence.
If you instead download sky angles, the bookkeeping is different. Our Horizons right-ascension example shows how an angle can wrap without a spacecraft jumping across the sky.
Sources and chart credit
- Exact Webb vector request, including the trajectory provenance header.
- Matching Earth-centered Sun vector request.
- JPL Horizons manual, for vector frames, output types and time scales.
- NASA Webb orbit overview, for the mission’s halo-orbit context.
Original chart and projection: LaunchDetect. Trajectory data: NASA Goddard FDF via JPL Horizons; Sun/Earth ephemeris: JPL DE441. No mission illustration is reproduced and no NASA or JPL endorsement is implied.