Launch Watch · Current evidence
Published
Bondville’s 2024 eclipse: sunlight fell, infrared persisted
Inspect 240 one-minute SURFRAD rows from the April 2024 eclipse. Reconstruct shortwave irradiance and compare it with downward thermal infrared.
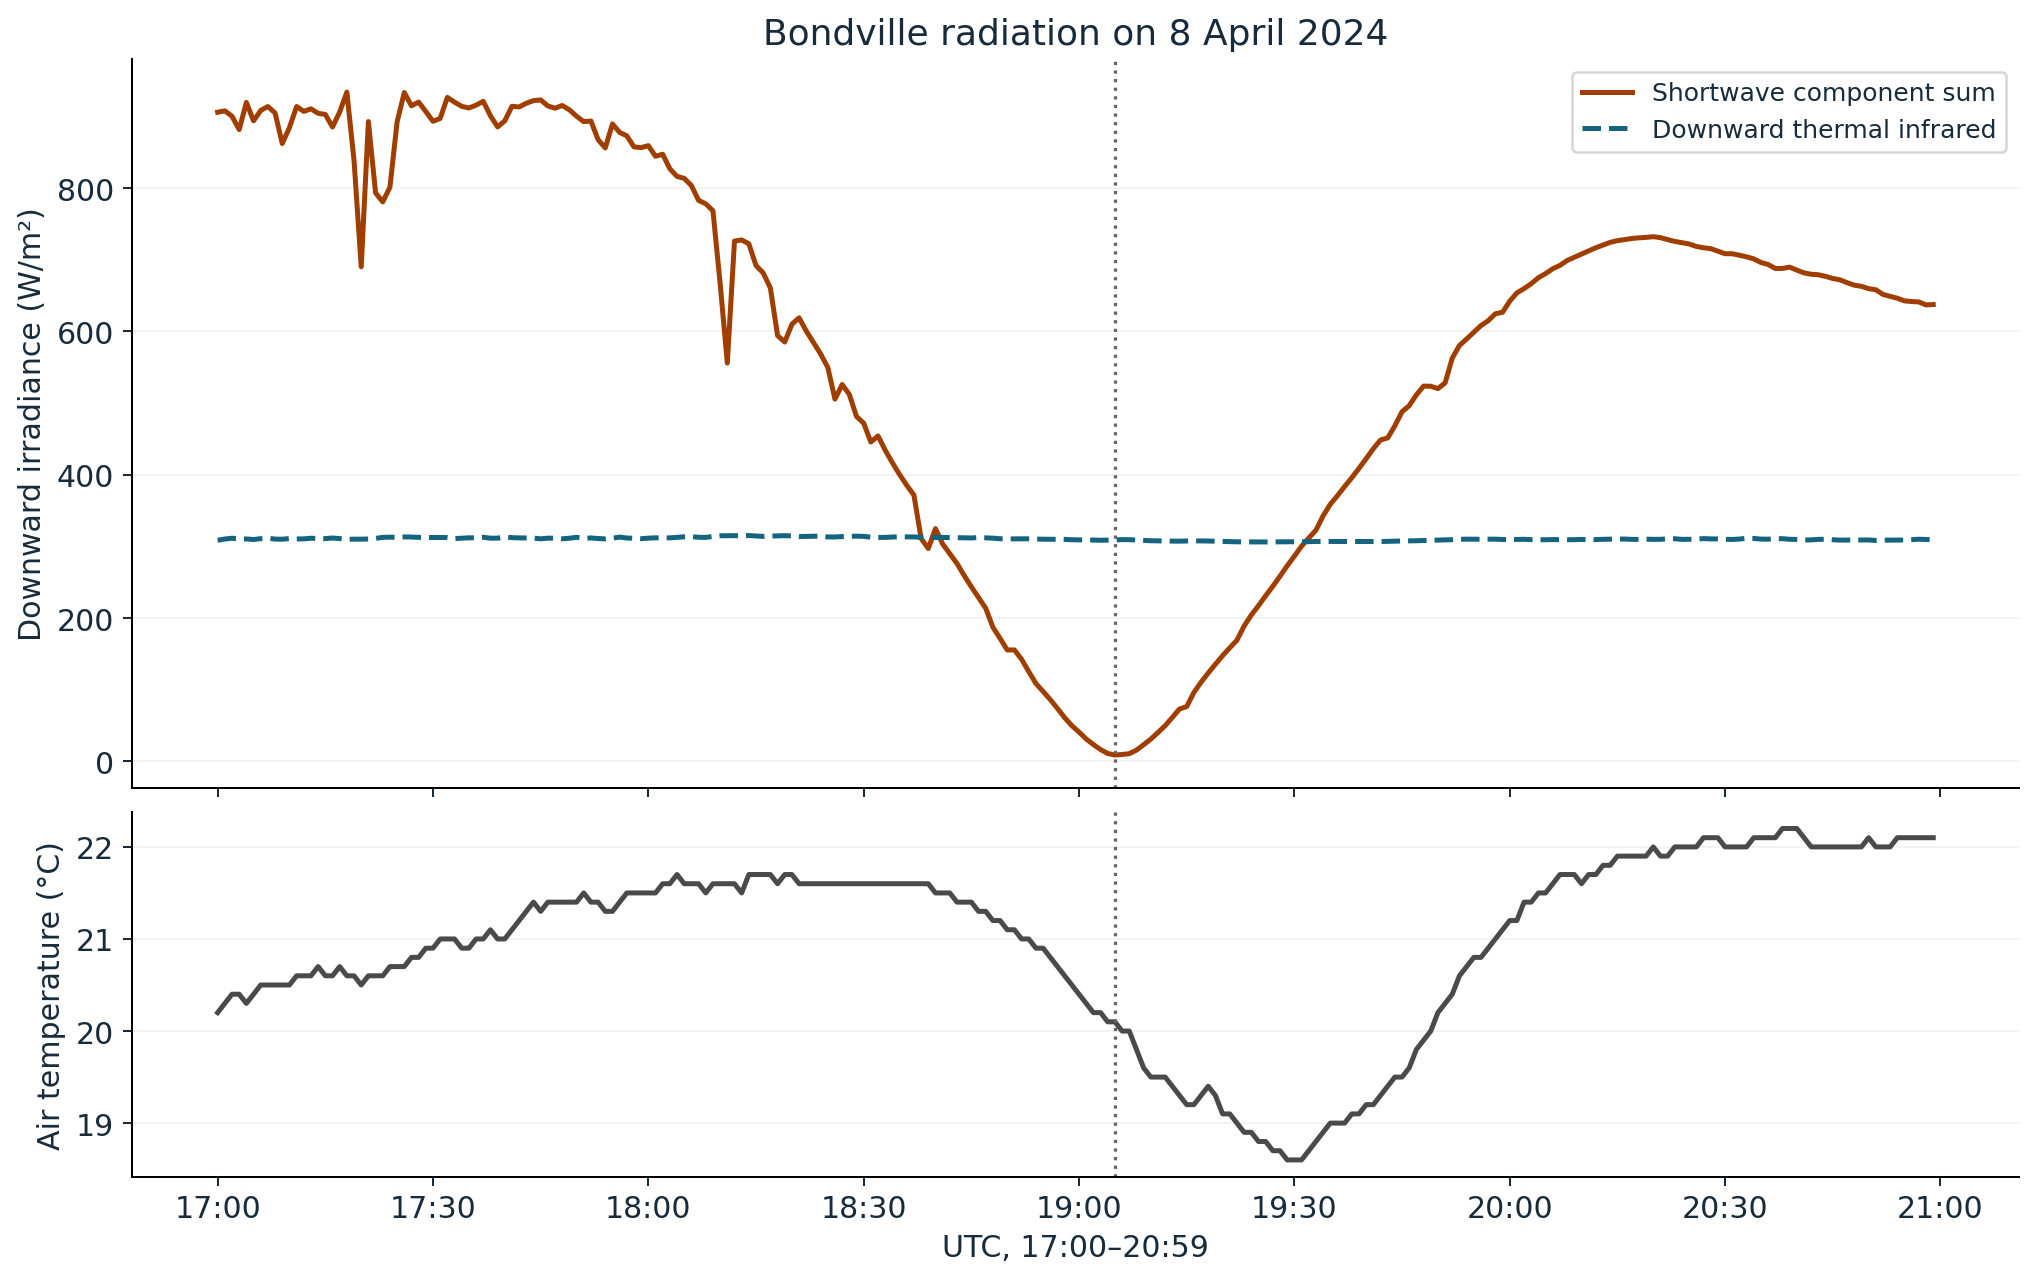
At 19:05 UTC on 8 April 2024, calculated downward shortwave radiation at NOAA’s Bondville station was just 8.85 watts per square metre. Downward thermal infrared at the same minute was 309.0 W/m². The sunlight channel had fallen dramatically; the longer-wavelength radiation channel still carried a substantial downward flux.
The contrast comes from one instrument site in Illinois during the 2024 solar eclipse. We extracted 240 one-minute records, from 17:00 through 20:59 UTC, from the official SURFRAD daily file. The comparison shows why a radiation plot needs to identify both wavelength range and direction.
Read the channels at the same minute
| Quantity | 18:00 UTC | 19:05 UTC |
|---|---|---|
| Direct-normal shortwave | 846.5 W/m² | 9.2 W/m² |
| Solar zenith angle | 32.47° | 35.95° |
| Diffuse-horizontal shortwave | 145.1 W/m² | 1.4 W/m² |
| Calculated horizontal shortwave | 859.27 W/m² | 8.85 W/m² |
| Separate global pyranometer | 869.2 W/m² | 8.9 W/m² |
| Downward thermal infrared | 311.5 W/m² | 309.0 W/m² |
The shortwave value at 18:00 provides a concrete earlier comparison. Its difference from the 19:05 value is about 850.42 W/m². This is an observed change between two times. It is not a fitted estimate of what the sunlight would have been without the eclipse, and it is not a percentage of the solar disk covered by the Moon.
The minimum is specifically the smallest calculated shortwave value in our four-hour window. It should not be relabeled the minimum for the entire UTC day, which also contains nighttime conditions, or the exact instant of maximum eclipse obscuration. Those are different questions.
Why direct plus diffuse needs a cosine
The direct-normal measurement describes radiation on a surface perpendicular to the Sun’s beam. The diffuse channel describes radiation received on a horizontal surface. Before adding them, the direct component must be projected onto the same horizontal plane.
For this daytime comparison, the calculation is: horizontal shortwave = direct-normal × cos(solar zenith angle) + diffuse-horizontal. At 19:05 the actual row gives 9.2 × cos(35.95°) + 1.4 = 8.8477 W/m², rounded to 8.85 in the article. The separate global pyranometer’s 8.9 W/m² is a useful adjacent check, rather than an input to that calculation.
The SURFRAD instrument overview explains the advantage of the component sum for estimating total solar radiation. Using it also makes the geometry visible: simply adding 9.2 and 1.4 would mix a normal-plane measurement with a horizontal one.
The extra decimal places are computational precision. They do not make the instruments accurate to hundredths of a watt per square metre. The source reports measurement values and quality information; the rounded sum is a reproducible calculation from those reported inputs.
Why thermal infrared remains on the chart
SURFRAD uses separate instruments for solar and thermal-infrared radiation. Its downward thermal-infrared channel measures radiation emitted toward the surface by clouds and other atmospheric constituents. Both quantities have W/m² units, but they cover different wavelength ranges.
At the selected minimum, describing the 309.0 W/m² thermal-infrared reading as “remaining sunlight” would misidentify the measurement. The useful observation is that the shortwave and thermal-infrared curves behave differently across the same minutes. Neither the infrared value nor a sum of these two downward channels is the net surface radiation budget, which also includes upward fluxes.
The lower panel displays air temperature as ancillary context. It helps readers see what else the station recorded, but no controlled temperature attribution is attempted. Clouds, wind and movement of air can affect conditions at the site. Comparing temperatures at two selected minutes would not, by itself, establish an isolated eclipse-cooling magnitude.
Match the site, time standard and quality flags
The source header identifies Bondville at 40.05°N, 88.37°W, with an elevation of 213 metres. All times here remain in UTC. The broader 2024 eclipse path and timing information provides event context, but the data are one station’s record. We make no claim that Bondville experienced totality or that these flux values apply elsewhere in Illinois.
The SURFRAD file documentation specifies one-minute averages for this period and a quality-control flag following each measured quantity. Zero indicates a passed check; missing measurements use a sentinel value. We verified zero flags for the direct, diffuse, global shortwave, downward infrared and air-temperature channels throughout the selected window.
The full daily file has 1,440 records. The extract has 240 distinct minute timestamps and no rejected values in those five channels. Passing those tests does not make a measurement uncertainty-free or guarantee that no future revision will occur. The daily archive remains subject to the provider’s quality-control and revision practices.
Download the minute-level comparison
Download the 240-row CSV. It includes timestamps, zenith angle, direct and diffuse shortwave, the calculated horizontal sum, the independent global measurement, downward thermal infrared, air temperature and their quality flags.
To reproduce it, skip the daily file’s two header lines and split each data row into its 48 whitespace-separated fields. In one-based numbering, zenith is field 8; global shortwave is 9; direct-normal is 13; diffuse-horizontal is 15; downward infrared is 17; and air temperature is 39. Each measured channel’s quality flag follows it. Field 41 is relative humidity, so selecting that column as temperature would produce a plausible-looking but wrong chart.
Retain 17:00 through 20:59 UTC, apply the channel-specific flag checks and compute the cosine using degrees. Then find the minimum of the derived shortwave column. The essential comparison is already in the static table above; scripts and interactive charts are optional.
Data credit: NOAA Global Monitoring Laboratory, SURFRAD, accessed 5 October 2026. The dataset README applies CC0 1.0 and requests these references: Augustine, DeLuisi and Long (2000), SURFRAD: A national surface radiation budget network for atmospheric research, Bulletin of the American Meteorological Society, 81, 2341–2357; and Augustine et al. (2005), An update on SURFRAD: The GCOS surface radiation budget network for the continental United States, Journal of Atmospheric and Oceanic Technology, 22, 1460–1472. Analysis and graphics are original, AI-assisted LaunchDetect work, not an official NOAA product.