Launch Watch · Spaceflight
Published
Twelve minutes near Arrokoth changed LORRI’s native image scale by about 2.5 times
Use two documented New Horizons ranges and LORRI’s nominal angular sampling to calculate about 83 and 33 meters per native pixel, without confusing pixels with resolved detail.
Twelve minutes made a large difference to the scale of New Horizons’ Arrokoth images. Two source-described composites, centered at 05:14 and 05:26 UT on January 1, 2019, were taken from ranges of 16,694 and 6,628 kilometers. At LORRI’s nominal native sampling, those ranges correspond to about 83 and 33 meters per detector pixel.
The linear-scale ratio is about 2.52. This calculation explains a range-driven change in native sampling; it does not establish that every 33-meter feature could be resolved, or that every pixel in a resampled web image has that footprint.
Keep the instrument fixed and change the range
The Planetary Data System’s LORRI description gives a nominal unbinned angular sample of 5 microradians per pixel. A microradian is one millionth of a radian. For this small angle, a perpendicular linear sample is approximately range multiplied by angular sample.
With range in kilometers, the unit conversion is simple: multiply by 1,000 to get meters, then by 0.000005. Equivalently, divide the range in kilometers by 200 to get the nominal meters per native sample.
| Product | Source time (UT) | Range (km) | Nominal native sample |
|---|---|---|---|
| Arrokoth earlier composite | 1 Jan 2019, 05:14 | 16,694 | About 83 m |
| Arrokoth later composite | 1 Jan 2019, 05:26 | 6,628 | About 33 m |
| Pluto close strip | 14 Jul 2015, 11:36 | About 17,000 | About 85 m |
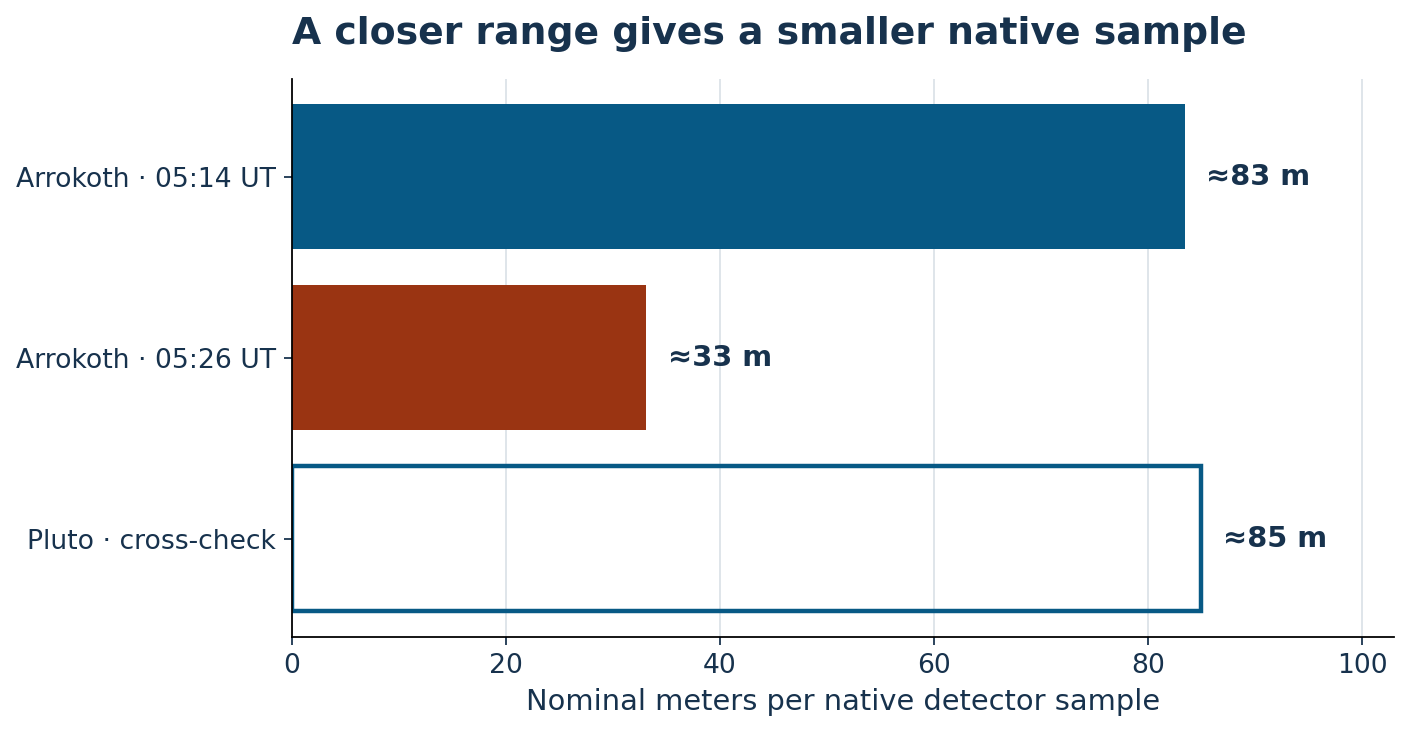
For the two Arrokoth ranges, 16,694 ÷ 6,628 gives 2.5187. We report about 2.5 times because the instrument description is rounded and a surface footprint also depends on viewing geometry. The arithmetic’s extra digits do not create extra measurement precision.
The composites changed in more than one way
NASA’s source article describes the earlier product as a seven-frame composite and the later product as a nine-frame composite. Each contributing frame had a 0.025-second exposure. The listed phase angles also differ: 16 degrees for the earlier image and 33 degrees for the later one.
The exposure arithmetic gives 0.175 and 0.225 seconds when the individual exposure durations are added. Those are sums across frames, not single continuous exposures. They cannot be used alone to claim a resolution gain or a particular improvement in noise.
The range comparison deliberately holds only the nominal detector angular sample fixed. Image stacking, sharpening, resampling, motion blur, signal strength and the projected surface can all affect the appearance of the finished product. A close encounter can improve sampling while the image-processing and viewing conditions are changing too.
A Pluto product supplies a useful numerical cross-check
The published description of a close Pluto strip places it around 17,000 kilometers from the spacecraft and gives a scale range of about 77–85 meters per pixel. The same nominal calculation gives 17,000 ÷ 200 = 85 meters.
That agreement is a check on units and order of magnitude. It is not a fresh measurement of the Pluto imagery. The source describes a sequence spanning roughly a minute, and its quoted scale is itself a range.
Reproduce the calculation without measuring a web image
The three-product CSV retains the quoted ranges and times, nominal angular sample, unrounded arithmetic, and documented composite exposure counts. Treat the decimal outputs as calculation intermediates rather than precise terrain dimensions.
Use the instrument’s native angular sample and the product-specific range. Do not count browser display pixels or infer native scale from the downloaded image’s width: web rendering and composite processing may change pixel dimensions. For binned products, the native five-microradian assumption would also need to be reconsidered.
We use Arrokoth, the object’s current name. The linked historical article uses its former nickname in the title. No new geological interpretation is drawn from these metadata, and no spacecraft photograph is republished here.
Sources and chart credit
- NASA’s February 2019 Arrokoth image release, especially the two composite captions.
- PDS LORRI instrument and dataset description, for angular sampling and binning.
- NASA Pluto close-strip description, for the independent scale check.
Original chart and arithmetic: LaunchDetect. Product metadata: NASA, Johns Hopkins APL and Southwest Research Institute; instrument documentation: NASA PDS. No institutional endorsement is implied.