Launch Watch · Current evidence
Published
2023 vs. 2024 ozone-hole duration: 113 days versus 76
Compare 153 daily ozone-hole areas in each year. Reproduce two threshold counts, peak dates and the limits of a size-versus-duration comparison.
Across the same 153 calendar days, the Antarctic ozone-hole area stayed above 10 million square kilometres on 113 days in 2023 and 76 days in 2024. That 37-day difference adds something a single annual maximum cannot show: how often a substantial area persisted through the season.
These are LaunchDetect calculations from the 2023 and 2024 NASA Ozone Watch daily files. We use 1 August through 31 December in both years and count strictly above a stated area threshold. This is a historical comparison of two complete windows, not an estimate of the ozone hole’s total lifetime.
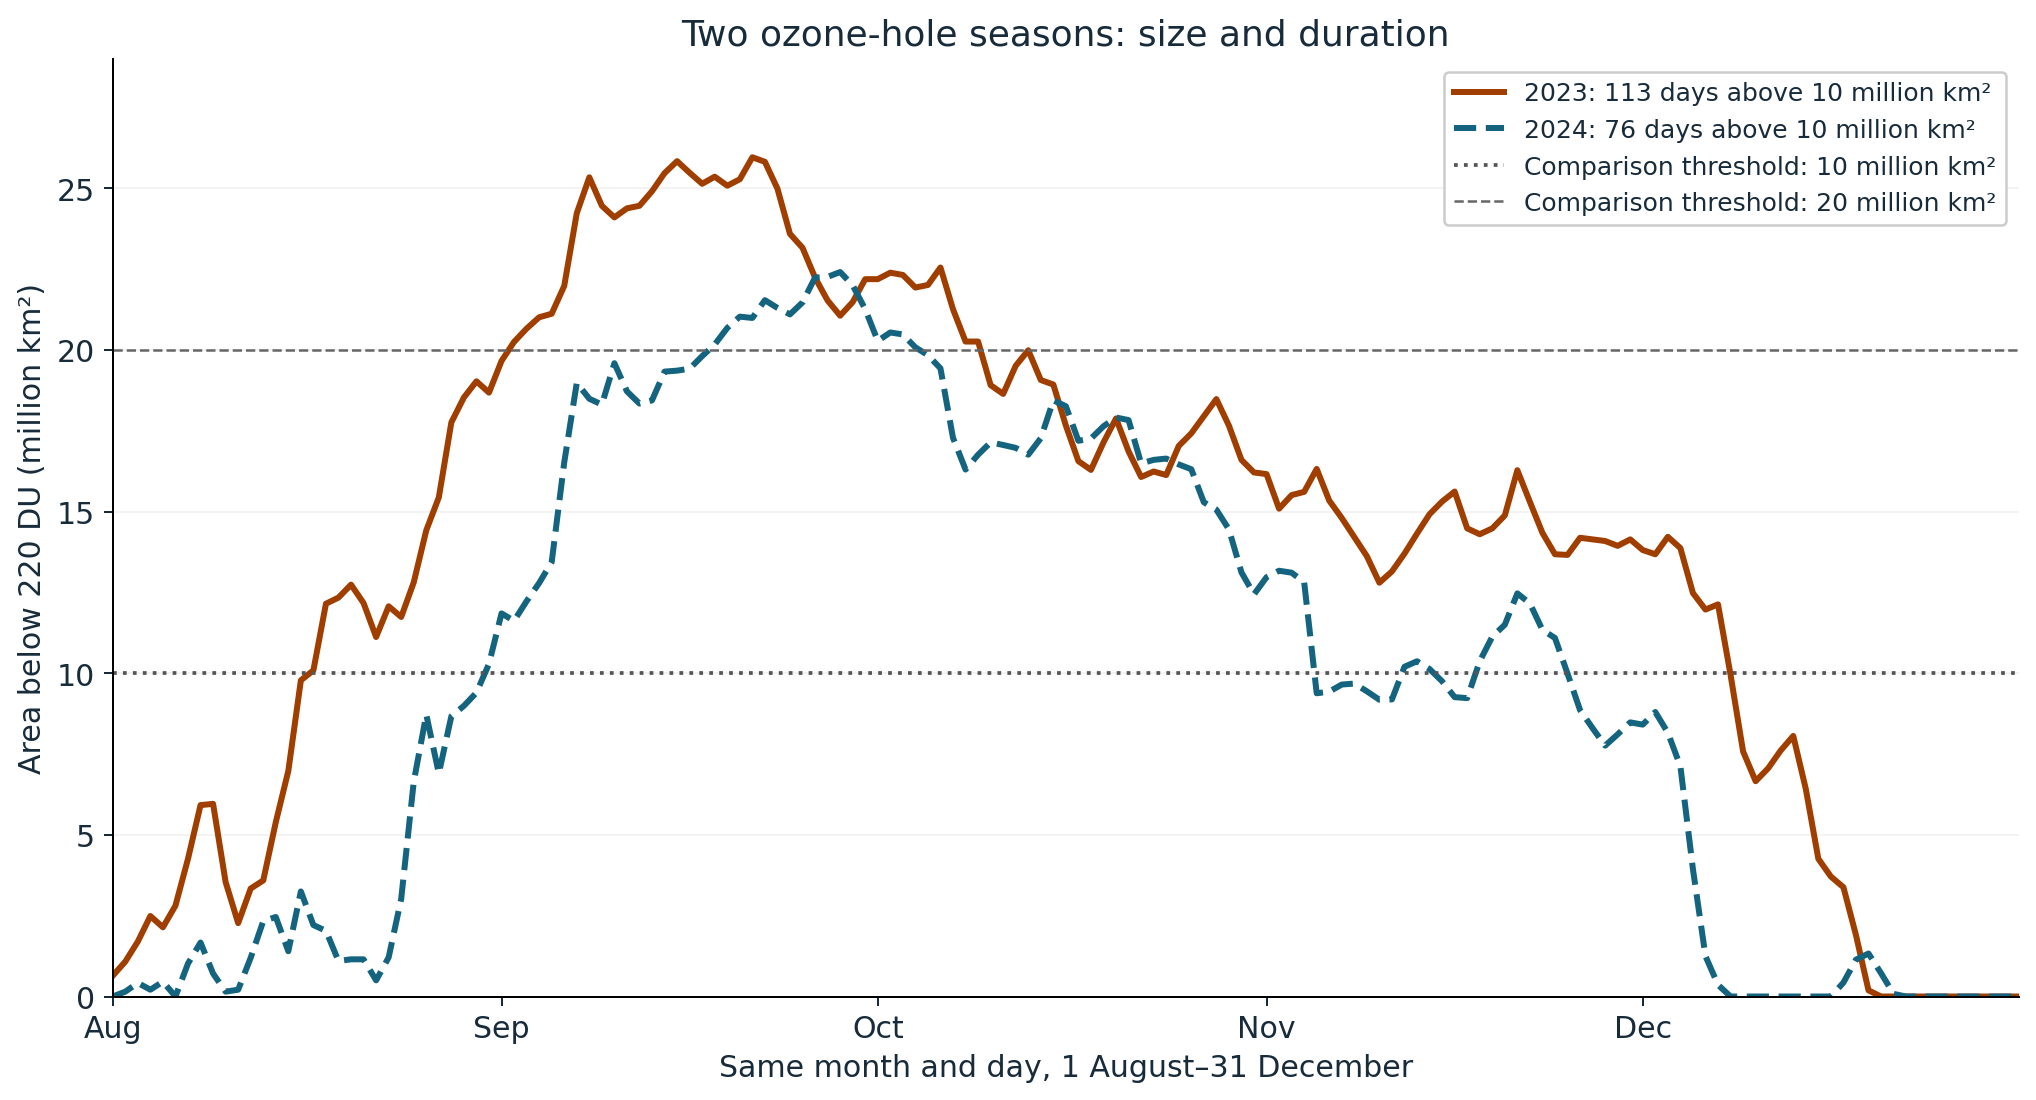
What the two thresholds reveal
| Measure | 2023 | 2024 |
|---|---|---|
| Valid daily values | 153 | 153 |
| Days above 10 million km² | 113 | 76 |
| Days above 20 million km² | 38 | 17 |
| Largest daily area | 25.96 million km² | 22.41 million km² |
| Date of largest daily area | 21 September | 28 September |
The choice of threshold changes the question. At 10 million km², we count days with a moderately large area. At 20 million km², we count days with a much larger area. The second comparison is 38 days versus 17, a difference of 21 days. Both comparisons put 2023 above 2024, but their counts should always travel with their thresholds.
The maxima tell a related, narrower story. The 2023 peak exceeds the 2024 peak by 3.55 million km². A peak summarizes one day; a threshold count uses the whole selected window. Neither measure substitutes for the other. When a headline says one ozone hole was “smaller,” checking whether it refers to a daily maximum, a seasonal mean or time above a threshold makes the statement much easier to interpret.
Counts also need not describe one uninterrupted interval. A curve can cross a threshold, fall below it and cross again. The calculation here counts qualifying rows wherever they occur between the two endpoints. It does not use the first and last crossing to declare a continuous 113-day or 76-day episode.
220 Dobson units defines the area being counted
The underlying Ozone Watch method description defines ozone-hole area as the region south of 40°S with total-column ozone below 220 Dobson units, or DU. Total-column ozone measures ozone through the atmospheric column. The “hole” label does not mean the column contains no ozone.
There are therefore two different thresholds in this article. The source’s 220-DU threshold determines which area enters each daily value. Our 10- and 20-million-km² thresholds are then applied to those daily area values. They do not replace the underlying ozone definition.
The daily area product also includes processing beyond the satellite observations themselves. Missing coverage, including polar night and bad orbits, is filled using assimilated ozone data. The method page identifies GEOS FP for that gap filling from September 2017 onward. A complete 153-row table should not be described as 153 days of wholly unfilled satellite coverage.
Reproduce the comparison in a spreadsheet
Download the 153-row aligned daily comparison. It contains each month-and-day, the two area values and a separate 1-or-0 column for each threshold test. The table and chart above contain the essential result without an interactive display.
- Open each linked source file and retain the Date and Data fields. The later columns are climatological statistics; they are not additional observations for that date.
- Select 1 August through 31 December inclusive. Verify 153 unique dates in each year. A missing value is marked −9999.0; it must not be treated as a small ozone-hole area.
- Count values strictly greater than 10.00, then strictly greater than 20.00. The source unit is million km², so a value of 10.00 already means 10 million km².
- Check the largest Data value and its date separately. Do not take a maximum from the climatology columns.
In these downloaded windows every date has a nonnegative area value. No missing day was filled by our calculation. Aligning the years by month and day also avoids a leap-year trap: 2024 has an extra February day, but both August–December windows have the same length.
An optional area-duration summary
Adding the daily areas across the window gives 2,158.93 million km²-days in 2023 and 1,537.15 million km²-days in 2024. Each row represents one day, so the sum describes area accumulated over time. It lets a broad, sustained curve contribute more than a brief spike.
That number is deliberately secondary here. Area-days do not measure missing ozone mass, chemical destruction or human ultraviolet exposure. Ozone Watch publishes a separate mass-deficit quantity; simply adding areas cannot reconstruct it. Keeping the daily curves and threshold counts alongside the sum prevents one derived number from carrying more meaning than its inputs allow.
What this comparison can support
The supported conclusion is specific: during a matched August–December window, 2023 had more days above both selected area thresholds than 2024, as well as a larger daily maximum. Two seasons and one area product cannot establish a recovery rate or isolate the effect of temperature, chemistry or a volcanic event.
For another pair of years, keep the window, area definition and threshold rule fixed before comparing the counts. If the source files are revised, rerun the calculation and retain the new version. The figures here use files retrieved on 5 October 2026.
Source credit: NASA Ozone Watch. This AI-assisted article, analysis and graphics are original LaunchDetect work based on the linked public data. NASA has not reviewed or endorsed this work and is not responsible for its interpretation. No NASA artwork, logos or photographs are reproduced.