Launch Watch · Spaceflight
Published
The closest Moon of 2024 was almost new
An audit of 8,784 hourly Moon samples separates distance, apparent size and phase, with proportional outlines and a downloadable data table.
The closest hourly Moon sample in 2024 was almost completely unlit from Earth: 356,895 kilometers away and 0.05% illuminated, at 07:00 UTC on March 10. Nearness alone did not make it a full Moon.
That result comes from checking all 8,784 hours in NASA’s Scientific Visualization Studio 2024 Moon dataset. The useful question is what “biggest Moon” means: the widest apparent disk in any phase, or the widest one when the disk is almost fully illuminated?
The size and phase filters answer different questions
The data describe a geocentric view, from Earth’s center. Apparent diameter measures how wide the Moon’s disk spans on the sky. Illuminated fraction measures how much of that disk is sunlit. The changing Earth–Moon distance and the Sun–Earth–Moon geometry give those columns different jobs.
We first searched the whole year for the smallest distance. Then we repeated the size comparison using only samples at least 99% illuminated. That second selection contains 507 hourly samples. It is an explicit filter for this article, rather than a definition of “supermoon.”
| Selection | UTC sample | Distance (km) | Illuminated (%) | Diameter (arcsec) |
|---|---|---|---|---|
| Closest distance | 10 Mar, 07:00 | 356,895 | 0.05 | 2,008.2 |
| Farthest distance | 2 Oct, 19:00 | 406,515 | 0.00 | 1,763.1 |
| Largest within ≥99% lit subset¹ | 16 Oct, 23:00 | 357,186 | 99.58 | 2,006.6 |
| Smallest within ≥99% lit subset¹ | 25 Feb, 12:00 | 406,298 | 99.10 | 1,764.0 |
¹For the size-filtered rows, the listed timestamp is the first sample attaining that rounded extreme. Several hours can share a rounded diameter. A displayed 0.00% also reflects the precision of the source field.
The nearest-distance row and the farthest-distance row are both near new Moon. Within the 99%-illuminated selection, the widest sampled disk occurs in October and the narrowest in February. A headline about “the closest Moon” needs its phase condition stated before the reader can know which comparison it describes.
A 13.90% diameter difference makes a 29.74% area difference
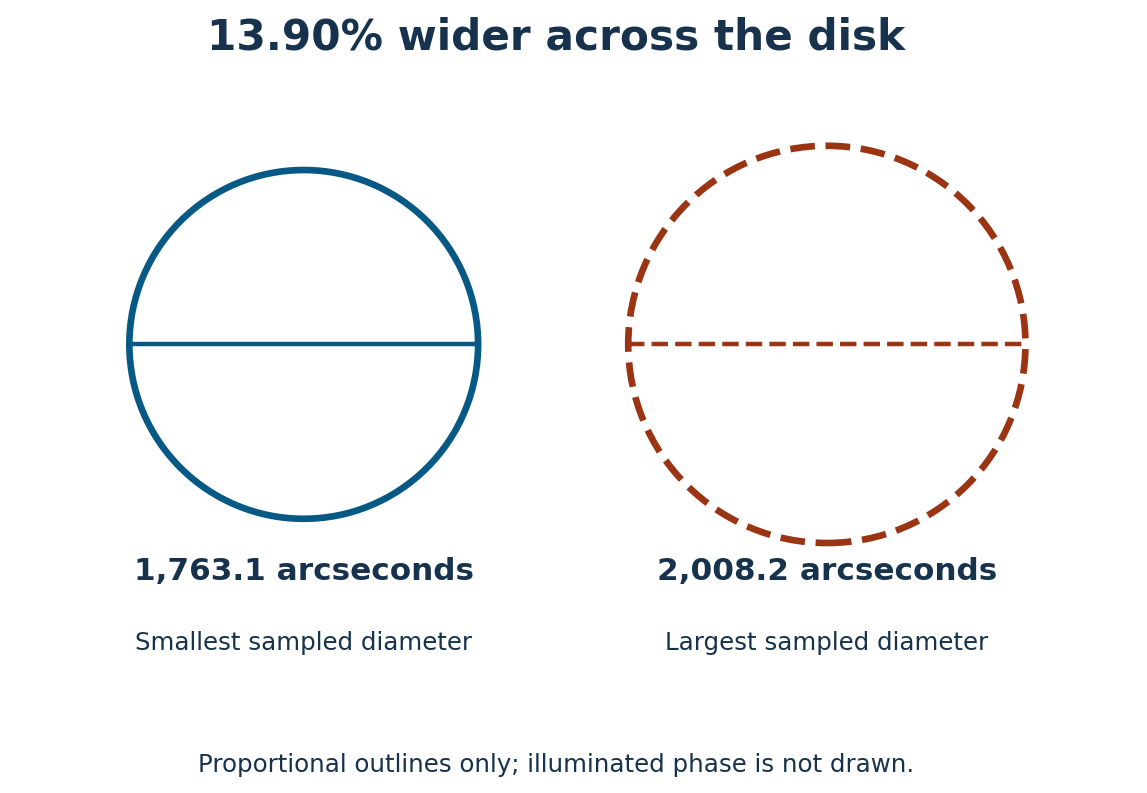
The full-year angular diameters range from 1,763.1 to 2,008.2 arcseconds. Dividing the larger by the smaller gives 1.1390: 13.90% wider. An arcsecond is an angular unit, so neither number describes a change in the Moon’s physical width.
For circular outlines, area scales with diameter squared. Squaring 1.1390 gives 1.2974, or 29.74% more apparent disk area. This geometric comparison does not calculate brightness. In particular, the March maximum-size sample is nearly new; drawing its outline as a bright full disk would hide the central finding.
The near-full-only diameter ratio is 2,006.6 ÷ 1,764.0, giving 13.75%. It is close to the whole-year size range, but it comes from different selected hours. The two calculations should retain their separate labels.
Reproduce the result without a telescope
- Open the 8,784-row hourly CSV, derived from the linked NASA SVS file.
- Find the minimum in the geocentric-distance column. Read its illuminated-fraction column on the same row.
- Find the smallest and largest angular diameter across all rows. Divide maximum by minimum; subtract one and multiply by 100 for the percentage difference.
- Filter illuminated fraction to at least 99, then repeat the diameter comparison. The download includes that filter as a 0-or-1 column.
The original file has 8,785 rows because it includes the start of January 1, 2025. We exclude that endpoint. The retained source bytes were checked on October 5, 2026; this is a historical model-data exercise, not a forecast for the current month.
Hourly sampling and rounded fields cannot establish the exact instant of perigee, apogee or full Moon. A person on Earth’s surface also has a different observing position from the geocentric model. This analysis is not an observing recommendation: do not attempt to locate a near-new Moon close to the Sun through binoculars or a telescope.
For a different way a Moon image can mislead, see our EPIC color-timing example. There the issue is how color channels were acquired; here it is which numerical quantity a size claim selected.
Sources and image credit
- NASA SVS: Moon Phase and Libration, 2024, including the geocentric scope and units.
- Hourly numerical source file, used for the independent calculations.
- SVS reuse guidance. This article uses numerical facts and an original chart, not SVS animation frames or music.
Data credit: NASA’s Scientific Visualization Studio. Chart and analysis: LaunchDetect. No NASA endorsement is implied.