Launch Watch · Current evidence
Published
Sioux Falls snow-week sunlight: 23% versus 75% reflected
Reconstruct two three-hour radiation windows around January 2024 snowfall, and calculate reflected-energy fractions from 360 quality-checked minutes.
During a three-hour window on 7 January 2024, the Sioux Falls SURFRAD station reflected about 22.9% of the incoming shortwave energy. In the same UTC window on 10 January, the fraction was 75.4%. A major regional snowstorm occurred between those observations.
The second window received less sunlight overall, yet reflected more energy upward. That combination is easier to understand when incoming and reflected radiation are kept separate, then compared over exactly the same duration.
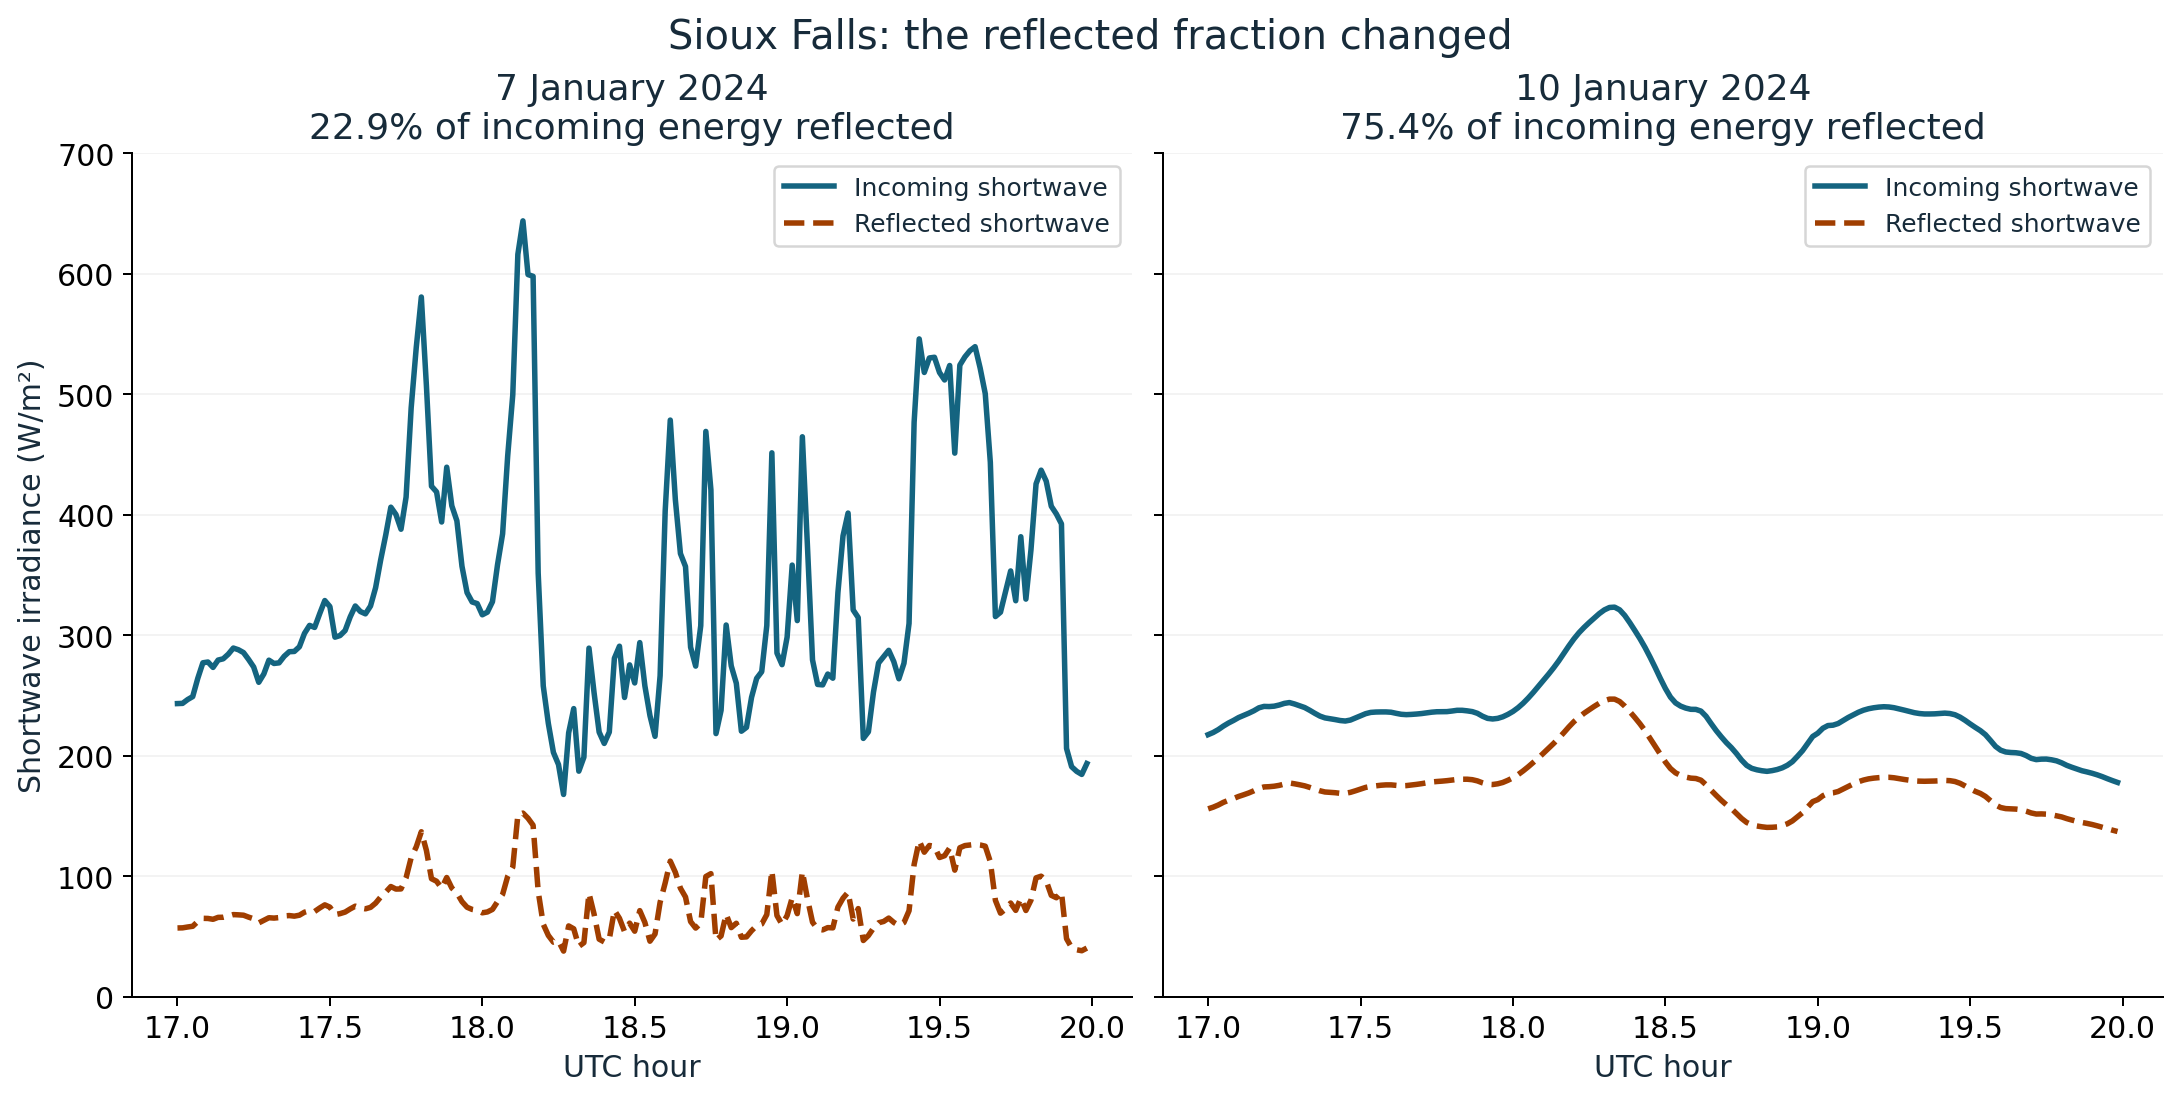
Less arrived, but more was reflected
| Quantity | 7 January | 10 January |
|---|---|---|
| Incoming shortwave energy | 1.0101 kWh/m² | 0.6999 kWh/m² |
| Reflected shortwave energy | 0.2312 kWh/m² | 0.5279 kWh/m² |
| Reflected / incoming energy | 22.9% | 75.4% |
| Incoming minus reflected | 0.7789 kWh/m² | 0.1720 kWh/m² |
The two reflected fractions differ by about 52.5 percentage points. The incoming-minus-reflected quantity also changes substantially. It is the net shortwave contribution over this selected window, not the complete surface energy budget: thermal infrared, turbulent exchanges and ground heat are outside this calculation.
The values come from the 7 January and 10 January station files. They are measurements over the radiometers’ local footprint. Nothing in this two-day extract turns them into a city-wide average or a regional estimate of reflected solar energy.
Calculate a fraction of energy with a ratio of sums
Each record represents one minute. To estimate incoming energy in kWh/m², sum the one-minute incoming flux values in W/m², divide by 60 to convert the minute durations to hours, then divide by 1,000 to convert watt-hours to kilowatt-hours. Apply the same conversion to the upward, reflected flux.
The fraction is then total reflected energy ÷ total incoming energy. Because every sample has the same duration, the time and unit-conversion factors cancel in that ratio. Dividing the sum of reflected fluxes by the sum of incoming fluxes gives the same fraction.
A simple average of each minute’s reflected/incoming ratio is a different calculation. It gives a dim minute the same influence as a bright minute. The ratio of sums answers the question here: what fraction of all the incoming energy during the window was reflected?
The rounded table values give approximately the same percentages. The reported 22.9% and 75.4% were calculated before rounding the energy totals. Keeping the full values during calculation and rounding at the end avoids discrepancies created by short display decimals.
Reconstruct the incoming horizontal flux
SURFRAD measures direct-normal and diffuse-horizontal shortwave radiation separately. Following the instrument overview, we project the direct component onto a horizontal plane before adding the diffuse component: incoming = direct-normal × cos(solar zenith angle) + diffuse-horizontal.
The reflected channel is the upward shortwave measurement. It is not obtained by subtracting a model from the incoming curve. Keeping that independent measurement is what allows the reflected fraction to change even when the amount of incoming sunlight changes too.
The paired quantities form a local broadband reflected fraction under the observed illumination conditions. This should not be substituted for a satellite spectral-reflectance value or a separately defined black-sky or white-sky albedo product. The measurement geometry and averaging are part of the result.
Why these 180 minutes are comparable
We selected 17:00 through 19:59 UTC on both days, then required the direct, diffuse and upward-shortwave quality flags to be zero. We also required calculated incoming shortwave to exceed 100 W/m². That avoids interpreting a daylight fraction using a near-zero denominator.
All 180 selected records on each day pass those tests. Thus the energy comparison uses the full three hours on both dates rather than different amounts of surviving data. The SURFRAD daily-file documentation defines the flags and one-minute averaging, and warns that data may be revised as quality control develops.
Matching a clock window does not hold everything else fixed. Sky conditions, solar geometry and surface state can differ between dates. The result describes what the instruments recorded during these windows; it is not a controlled experiment with one changed variable.
What the snow report adds
The National Weather Service event summary documents a widespread snowstorm beginning on 8 January and ending early on 9 January 2024. That places a major snowfall event between our two radiation records and supplies useful context for the changed reflected fraction.
The regional report does not measure snow depth at the SURFRAD radiometer footprint for this calculation. We therefore do not assign a specific snow depth to either curve or claim to have isolated exactly how much of the change was caused by snow. A local surface-observation record would be needed for a more tightly constrained explanation.
Reuse the method on another pair of days
Download the 360 minute-level rows. They retain timestamps, solar zenith, direct and diffuse components, incoming and reflected fluxes, the three quality flags and the per-minute ratios. The integrated comparison and its interpretation are fully visible in the static table above.
For another date pair, state the station, time window and quality rule first. Check that comparable durations survive. Then integrate the two flux streams separately and divide their totals. If missing or rejected minutes shorten one window, report that difference or choose a common valid set instead of comparing unmatched sums.
Source credit: NOAA Global Monitoring Laboratory, SURFRAD, accessed 5 October 2026. The dataset README specifies CC0 1.0 and requests Augustine, DeLuisi and Long (2000), SURFRAD: A national surface radiation budget network for atmospheric research, Bulletin of the American Meteorological Society, 81, 2341–2357; and Augustine et al. (2005), An update on SURFRAD: The GCOS surface radiation budget network for the continental United States, Journal of Atmospheric and Oceanic Technology, 22, 1460–1472. This AI-assisted analysis and original chart are LaunchDetect work, not an official NOAA product.