Launch Watch · Current evidence
Published
Idalia week: track the same 284 Gulf temperature cells
Reproduce a fixed-grid daily OISST comparison across August–September 2023, with area weights, cell-level differences and limits on storm attribution.
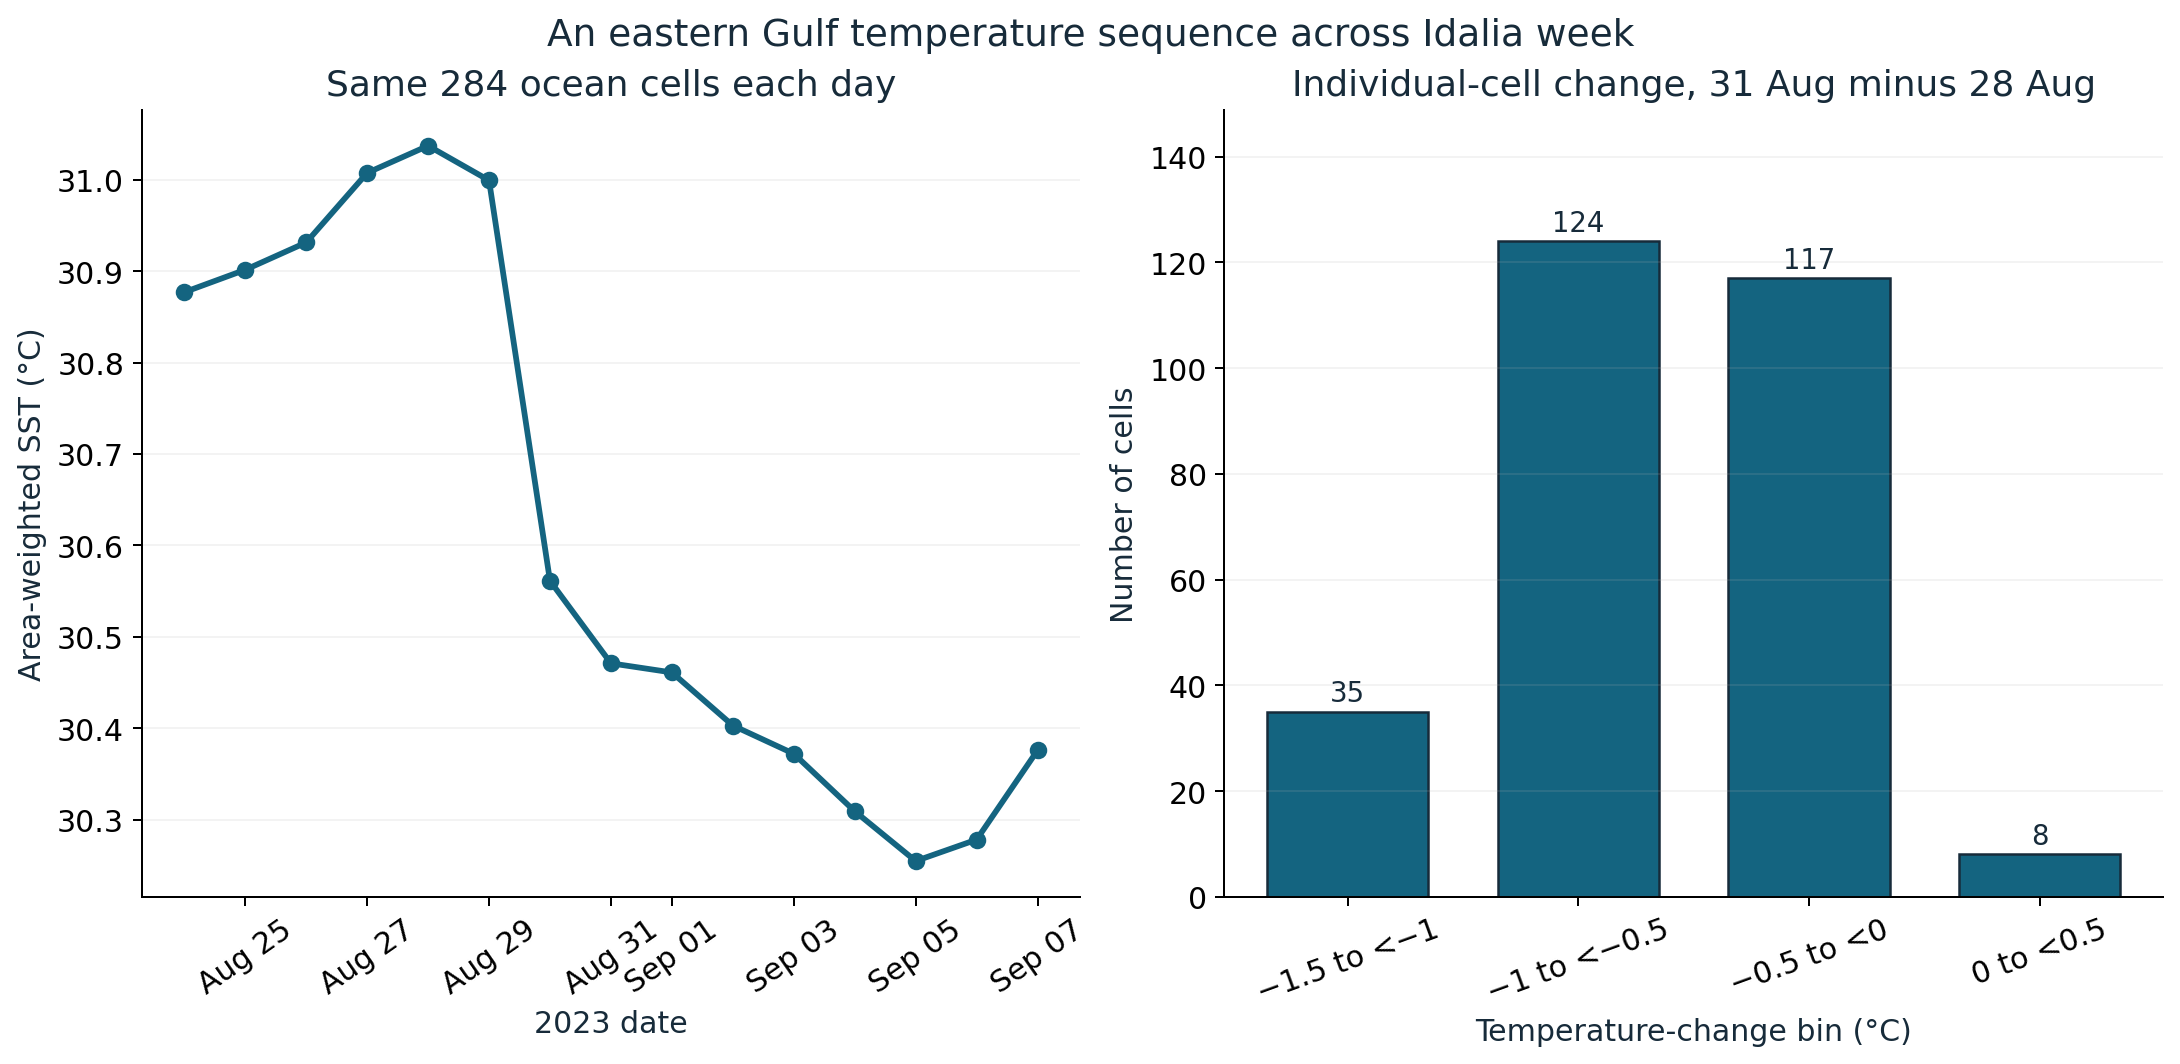
For a fixed set of 284 ocean grid cells in the eastern Gulf of Mexico, the area-weighted daily sea-surface-temperature estimate fell from 31.037°C on 28 August 2023 to 30.471°C on 31 August. The difference is −0.566°C in this selected area during Idalia week.
The individual cells did not all change by the same amount. Their 31-August-minus-28-August differences range from −1.33°C to +0.09°C. Following a fixed set of cells makes that variation visible without silently changing the area included in each day’s mean.
Define the area before comparing its temperatures
Selected cell centres span 26.125°N to 30.125°N and 86.875°W to 82.125°W. We begin with the quarter-degree grid in that rectangle, then keep only cells with valid SST values on every one of the 15 days from 24 August through 7 September.
The resulting common set contains 284 ocean cells. Every plotted daily mean uses exactly those locations. The coordinate limits describe cell centres, so they should not be mistaken for the outer edges of a precisely drawn polygon.
This fixed mask matters. If each day used whichever locations happened to be valid that day, a regional mean could change partly because its geographic membership changed. Holding the cell set fixed removes that particular ambiguity. It does not remove uncertainty in the underlying temperature analysis.
| Date | Mean SST | Role in this comparison |
|---|---|---|
| 28 August 2023 | 31.037°C | First difference endpoint |
| 31 August 2023 | 30.471°C | Second difference endpoint |
| 5 September 2023 | 30.255°C | Lowest mean in the 15-day window |
| 7 September 2023 | 30.376°C | Last selected day |
The minimum occurs several days after the two comparison endpoints. Keeping the full sequence visible helps prevent a chosen before-and-after pair from standing in for the entire time history. The 5 September value is a daily analysis minimum within this window, not an instantaneous measurement of a post-storm ocean surface.
Use area weights on a latitude–longitude grid
Quarter-degree cells at different latitudes do not have identical surface areas. For this regular grid, we weight each retained cell by the cosine of its centre latitude, sum temperature multiplied by weight, and divide by the sum of weights.
That produces 31.0369897°C and 30.4710793°C for the two endpoints before display rounding. Subtracting later minus earlier gives −0.5659103°C, reported as −0.566°C. The extra calculation digits make the reproduction check transparent; they are not a claim of thousandth-degree physical accuracy.
The histogram answers a different question. Each of its 284 cells counts once, so it shows the distribution of locations rather than area-weighted energy or a frequency of independent satellite observations. All four bin counts are listed below.
| Change interval | Cell count |
|---|---|
| −1.5 to below −1.0 | 35 |
| −1.0 to below −0.5 | 124 |
| −0.5 to below 0 | 117 |
| 0 to below +0.5 | 8 |
The eight nonnegative changes are a useful check on a sweeping description such as “every part of the box cooled.” The mean declined, while a small subset of cells had zero or positive differences. The largest positive difference was only +0.09°C, so no claim of a statistically meaningful local warming is made.
What OISST contributes to the record
The NOAA OISST product description explains that the analysis blends satellite and in-situ observations and uses optimal interpolation to fill gaps. The preserved archive metadata identifies version 2.1, daily SST in degrees Celsius, and the missing-value convention.
These are therefore gridded daily analysis estimates. A count of 284 retained cells is not a count of 284 independent, direct satellite measurements. Neighbouring cells and successive days can share information through the analysis method.
The time coordinate is expressed as days since 1 January 1800. The archive uses longitudes from 0° to 360° east; our reader data convert the western coordinates by subtracting 360°. For example, 273.125°E becomes 86.875°W. Changing the convention leaves the cell in the same place.
Keep the storm context separate from attribution
The contemporaneous Idalia overview places the hurricane in the Gulf on 29 August. It supplies the historical event context for these selected dates. The numerical values in this article come from the OISST archive, not from colours sampled from that story’s image.
The endpoint difference does not establish exactly how much Idalia cooled the Gulf. Currents, surface exchanges, sampling and analysis error have not been separated. The chosen rectangle is neither the whole Gulf nor an official cold-wake boundary.
A companion error-field retrieval was unavailable through the archive route used for this extract. We therefore report no confidence interval or significance test. Surface temperature alone also does not supply ocean heat content, subsurface temperature, a storm-intensification forecast or a hurricane-energy calculation.
Inspect the daily means and every included cell
Three downloads make the result reproducible: the 15-row daily-mean series, the 4,260 cell-day values and weights, and the 284 endpoint cell differences.
The primary ASCII subset includes a somewhat larger rectangle. Reproduce our result by applying the stated cell-centre limits, excluding the missing-value sentinel, building the all-days-valid mask, and then calculating each weighted mean from that common set. Keeping this geographic rule with the published number is essential.
Data citation: Huang et al. (2020), NOAA 0.25-degree Daily Optimum Interpolation Sea Surface Temperature, Version 2.1, dataset DOI, subset and dates specified above, accessed 5 October 2026. NOAA’s CDR use guidance permits public reuse and requests attribution. This AI-assisted analysis and original graphics are LaunchDetect work, with no NOAA or NASA review or endorsement implied.