Launch Watch · Evidence study
Published
Cuba 2019: the lightning mapper frame that contains a meteor
A two-region audit of a real GOES-16 frame shows why a lightning product name cannot classify every optical signal it contains.
The small blue-and-cyan patch over western Cuba in this GOES-16 frame belongs to a meteor-related flash. The larger colored group at the upper left belongs to lightning over the ocean. Both appear in the same Geostationary Lightning Mapper display.
That pairing, identified in NASA’s account of the February 1, 2019 event, makes a useful test case for anyone turning satellite products into event alerts. A product’s name can describe its principal job without determining the cause of every signal it contains.
Read two regions in one real frame
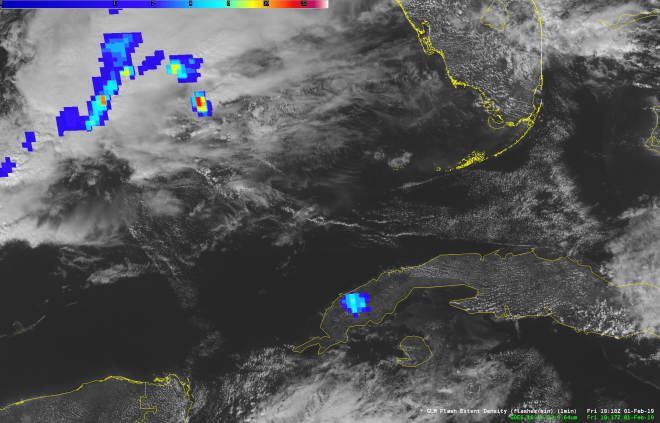
Start over western Cuba, near the lower middle of the image. A compact group of blue and cyan squares sits within the outlined island. Now look to the upper left, over the ocean. The colored group there is larger and spread across a cloudy region. These are visual descriptions of the rendered image, not a count of detected flashes.
We recorded each region’s product, visible appearance, source-provided identification and basis for that identification. The result is a two-row audit that keeps observation and interpretation separate:
| Region | What the image shows | Event class identified by NASA |
|---|---|---|
| Western Cuba | Compact blue/cyan group | Meteor-related flash |
| Upper-left ocean area | Larger colored group, including blue/cyan | Lightning activity |
The source attribution matters. We did not recover the meteor classification by applying a blue-pixel threshold. The two regions share colors, so the palette alone supplies no rule that separates their causes. The audit CSV preserves that distinction explicitly.
Test the tempting classification rule
Consider a simple rule: “If a colored feature appears in this GLM display, label its cause lightning.” Apply it to the western Cuba row. Its predicted label is lightning; NASA’s identification is a meteor-related flash. That one documented counterexample is enough to reject the rule as a universal interpretation of this product.
The ocean row explains why the rule can initially seem reasonable: there, it agrees with the source identification. Seeing one familiar example does not justify applying the same label to every feature. These two selected regions demonstrate the logical failure without establishing how often it happens across GLM data.
Reveal a safer record for the Cuba feature
- Instrument and product
- GOES-16 GLM layer in the NASA-hosted composite.
- Visible evidence
- A compact blue/cyan group over western Cuba.
- Interpreted event
- Meteor-related flash, attributed to NASA’s published account of SPoRT’s analysis.
- What remains unmeasured here
- Flash count, trajectory, energy and impact location.
Without the supporting event context, retain an unclassified optical transient rather than assign its cause from the product name.
Why a lightning instrument can register a meteor
The official GLM specification describes a single near-infrared channel at 777.4 nanometers and a 2-millisecond frame time. It also explicitly discusses bright-meteor detection. The detector responds to optical signals; lightning mapping is the principal application of those measurements.
Keep that acquisition timing separate from the image above. The provider still is a rendered one-minute GLM display over imagery. Its colored squares are not individual 2-millisecond detector frames, and their appearance does not provide a raw light curve. Nothing in this two-region reading measures meteor energy or reconstructs a trajectory.
This also explains the useful next step for an event system. Store the sensor and product identity alongside the signal’s location and time context, then attach a cause only when event-specific evidence supports it. The Cuba row can carry a meteor label because the documented analysis supports it. A new feature requires its own evidence.
Use the case at the scale it supports
This historical frame demonstrates that two different source-identified phenomena can coexist in a product designed for lightning. It does not provide a trained classifier, a false-positive rate or a detector-accuracy estimate. LaunchDetect is interpreting a documented case, not claiming first detection.
For this article, we use only the NASA-hosted SPoRT still. The official GOES-R first-quarter 2019 newsletter, page 3, reproduces the same image and credits NASA SPoRT. The separate CIMSS animation is outside this analysis.
The practical lesson fits in the two-row table: preserve what the sensor recorded, preserve who identified its cause, and make the link between those two things visible. That is how an unusual signal remains available for investigation instead of being lost inside the instrument’s familiar name.