Launch Watch · Evidence study
Published
The 2024 eclipse: a real test of a simple image-change rule
Reproduce a 48-frame NOAA eclipse-video test: one fixed patch triggers 17 change flags, while a comparison patch triggers none at the same threshold.
A fixed patch near Indianapolis falls from a mean display value of 128.30 to 2.52 in NOAA’s April 8, 2024 eclipse animation. A simple change rule flags 17 of its 48 frames. Run the same rule on a Florida comparison patch and it flags none.
Those are reproducible results from the published video, but they do not measure changed land cover or lost sunlight. They show how strongly an image-change rule can react during a known illumination event. The test is deliberately small: two fixed image regions, one historical animation, and an explicitly illustrative threshold.
The actual imagery behind the test
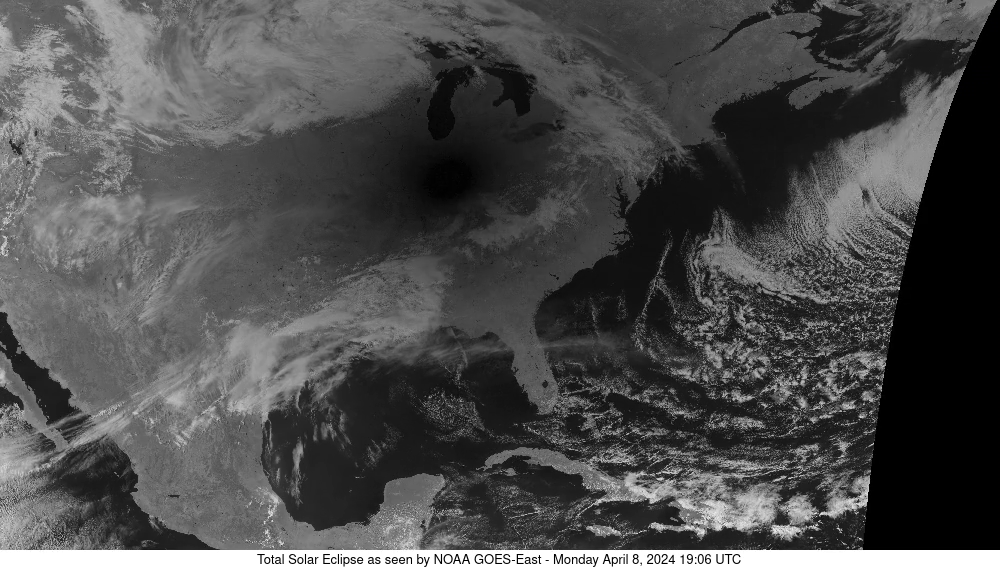
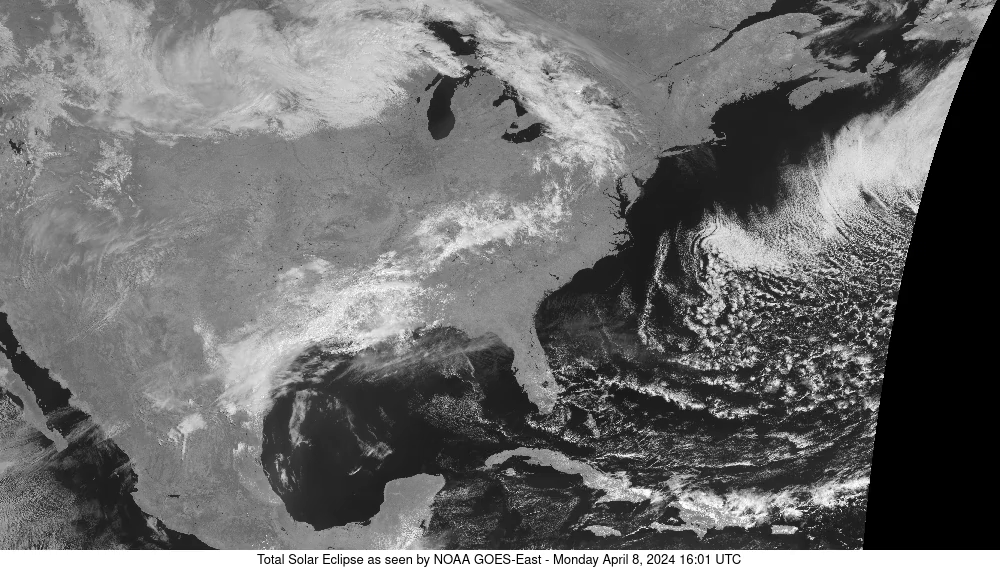
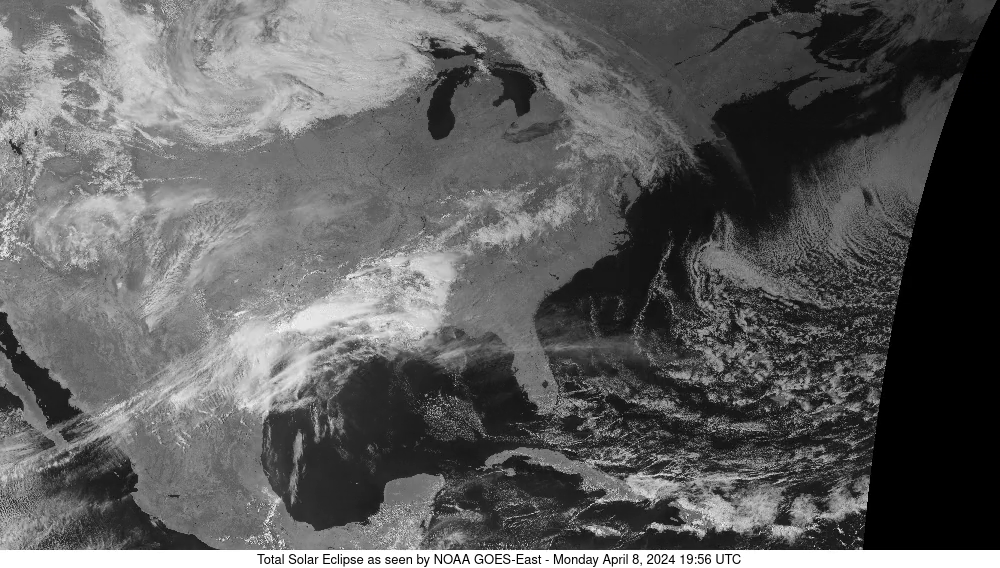
NOAA STAR’s eclipse archive offers several products. This analysis uses the unannotated GOES-East ABI Band 3 MP4, not the GeoColor movie. The file decodes to 48 frames at 1000 × 568 pixels. Its on-image UTC labels run from 16:01 to 19:56 on April 8, 2024, in five-minute steps.
The movie plays those frames in eight seconds at six frames per second. Playback speed is therefore separate from the observation-time progression printed on the images. The calculations use the decoded frames and their source labels, not the video playhead as an observation clock.
The extracted keyframes, chart and complete data tables below provide the evidence for this case. To see the original motion sequence, view the Band 3 source video on NOAA’s website (MP4, 3.58 MB). Source video and frames: NOAA / NESDIS Center for Satellite Applications and Research.
Two patches and one explicit rule
The labeled companion animation locates the Indianapolis area. We use it only as a locator; the pixel calculations use the unannotated file so that city names and the path overlay cannot enter the averages.
Coordinates below refer to the exact 1000 × 568 video frame. The origin is its top-left corner. The lower bounds are included and the upper bounds excluded, so each main region contains 16 × 16 = 256 pixels. These are image coordinates, with no asserted ground-area or precise geolocation conversion.
| Region | x range | y range | Pixels |
|---|---|---|---|
| Near source-labeled Indianapolis | 450 ≤ x < 466 | 164 ≤ y < 180 | 256 |
| Florida comparison patch | 560 ≤ x < 576 | 330 ≤ y < 346 | 256 |
For each patch in each frame, average all its decoded red, green and blue channel values. Each channel starts on a 0–255 display scale. Subtract that patch’s mean in frame 1. Flag the frame when the absolute difference is greater than 30 display units. The threshold is illustrative; we did not optimize it against a labeled validation set.
For the Indianapolis-area patch, the first mean is 128.30078125 and the frame-38 mean is 2.5234375. Their difference is −125.77734375 display units, which easily exceeds the 30-unit rule in magnitude. The last-frame mean recovers to 102.03125. These extra decimal places make the arithmetic reproducible, not physically precise.
What the full series shows
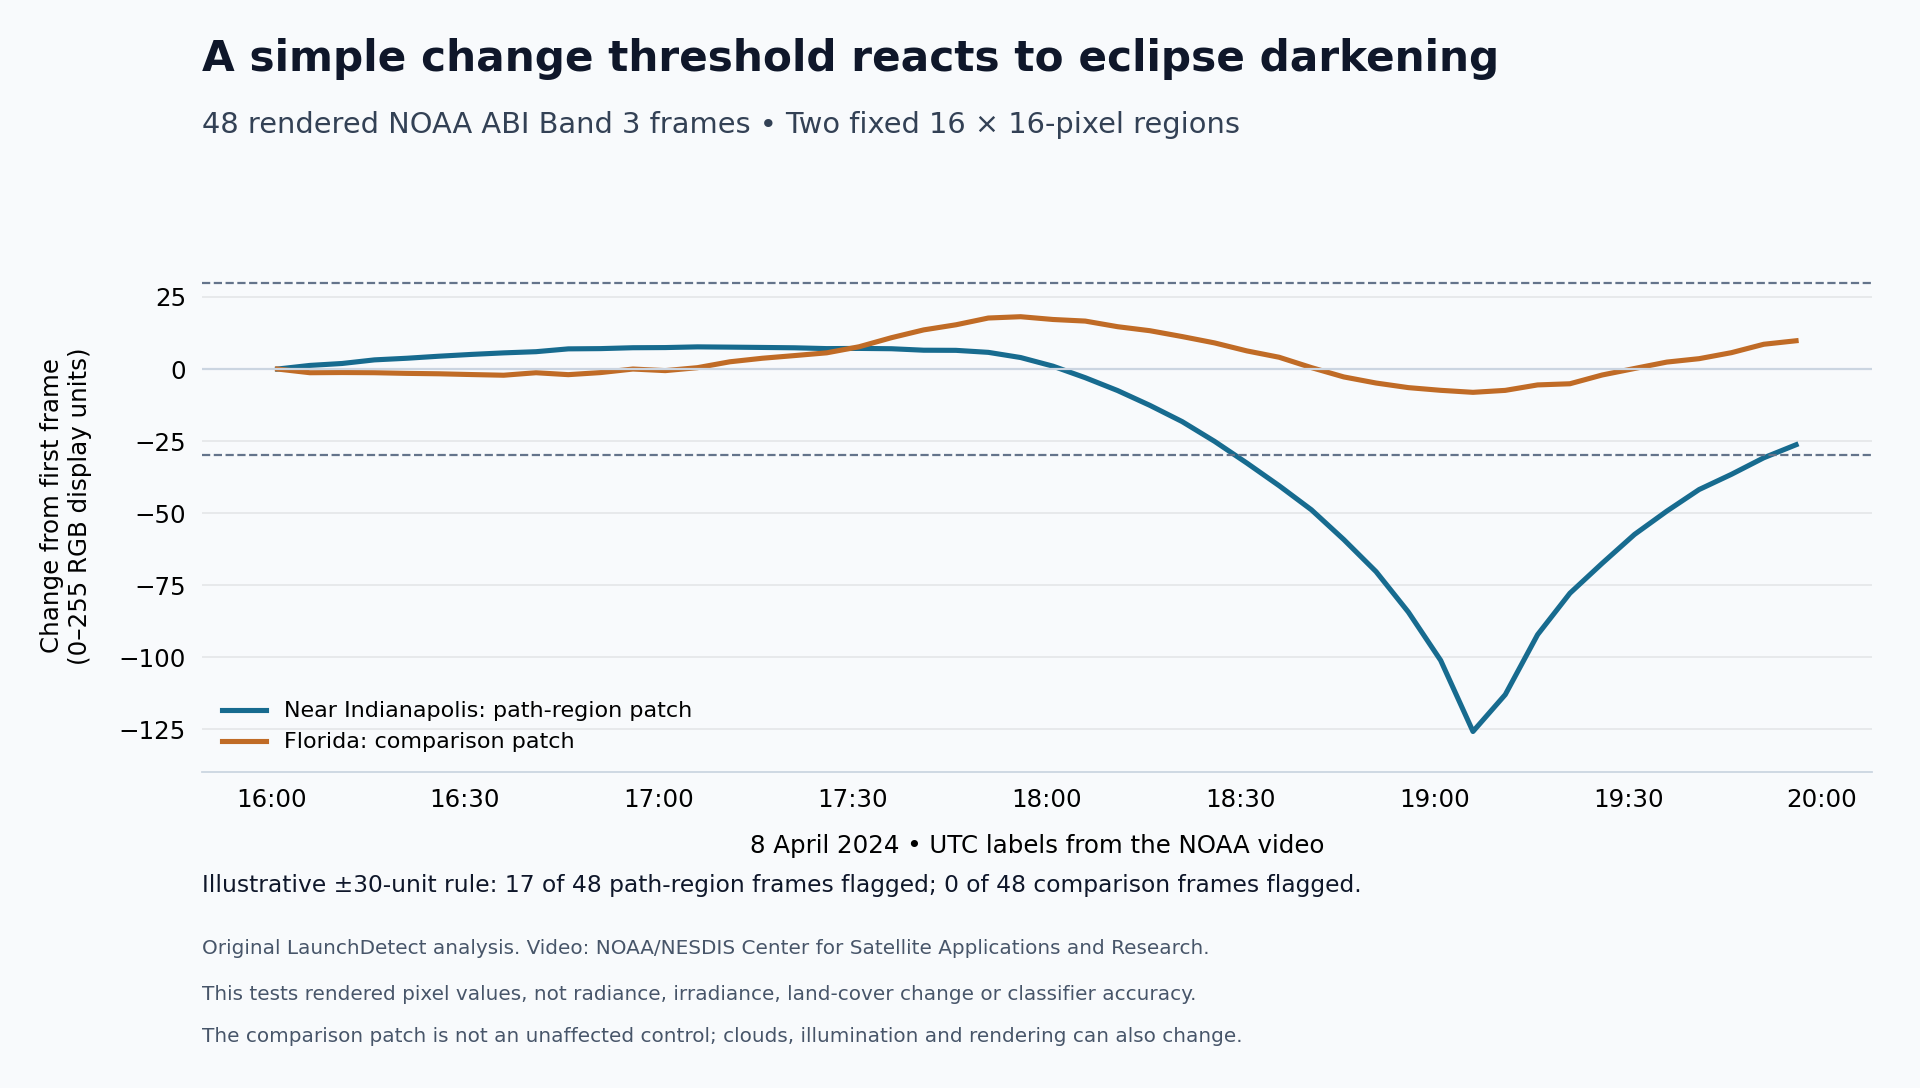
Frames 31 through 47 cross the threshold for the Indianapolis-area patch, giving 17 flags. The Florida patch’s largest absolute departure from its own first frame is about 18.16 units, so it produces zero flags at 30. The complete 48-row series below includes both means, their changes and the frame-level flags; the same values are available in the 48-row CSV.
Inspect all 48 frames and the exact display-space results
Means use decoded RGB display values on a 0–255 scale. Changes are relative to each patch’s first-frame mean. A flag means the absolute change exceeds 30 display units. These are rendered-image calculations, not physical radiance or detector-accuracy measurements.
| Frame | UTC on April 8, 2024 | Indianapolis-area mean | Florida mean | Indianapolis-area change | Florida change | Indianapolis-area flag | Florida flag |
|---|---|---|---|---|---|---|---|
| 1 | 16:01 | 128.30078125 | 54.45703125 | 0.0 | 0.0 | No | No |
| 2 | 16:06 | 129.5546875 | 53.1796875 | 1.25390625 | -1.27734375 | No | No |
| 3 | 16:11 | 130.23046875 | 53.24609375 | 1.9296875 | -1.2109375 | No | No |
| 4 | 16:16 | 131.48046875 | 53.18359375 | 3.1796875 | -1.2734375 | No | No |
| 5 | 16:21 | 132.04296875 | 52.953125 | 3.7421875 | -1.50390625 | No | No |
| 6 | 16:26 | 132.75390625 | 52.80859375 | 4.453125 | -1.6484375 | No | No |
| 7 | 16:31 | 133.375 | 52.54296875 | 5.07421875 | -1.9140625 | No | No |
| 8 | 16:36 | 133.91015625 | 52.30859375 | 5.609375 | -2.1484375 | No | No |
| 9 | 16:41 | 134.3203125 | 53.17578125 | 6.01953125 | -1.28125 | No | No |
| 10 | 16:46 | 135.30078125 | 52.5078125 | 7.0 | -1.94921875 | No | No |
| 11 | 16:51 | 135.38671875 | 53.2265625 | 7.0859375 | -1.23046875 | No | No |
| 12 | 16:56 | 135.6953125 | 54.45703125 | 7.39453125 | 0.0 | No | No |
| 13 | 17:01 | 135.75 | 53.90625 | 7.44921875 | -0.55078125 | No | No |
| 14 | 17:06 | 135.99609375 | 54.93359375 | 7.6953125 | 0.4765625 | No | No |
| 15 | 17:11 | 135.90234375 | 56.97265625 | 7.6015625 | 2.515625 | No | No |
| 16 | 17:16 | 135.79296875 | 58.1953125 | 7.4921875 | 3.73828125 | No | No |
| 17 | 17:21 | 135.671875 | 59.125 | 7.37109375 | 4.66796875 | No | No |
| 18 | 17:26 | 135.390625 | 60.0859375 | 7.08984375 | 5.62890625 | No | No |
| 19 | 17:31 | 135.45703125 | 62.1875 | 7.15625 | 7.73046875 | No | No |
| 20 | 17:36 | 135.34765625 | 65.33203125 | 7.046875 | 10.875 | No | No |
| 21 | 17:41 | 134.83203125 | 68.04296875 | 6.53125 | 13.5859375 | No | No |
| 22 | 17:46 | 134.78515625 | 69.81640625 | 6.484375 | 15.359375 | No | No |
| 23 | 17:51 | 134.08984375 | 72.16015625 | 5.7890625 | 17.703125 | No | No |
| 24 | 17:56 | 132.29296875 | 72.6171875 | 3.9921875 | 18.16015625 | No | No |
| 25 | 18:01 | 129.30078125 | 71.65234375 | 1.0 | 17.1953125 | No | No |
| 26 | 18:06 | 125.29296875 | 71.09765625 | -3.0078125 | 16.640625 | No | No |
| 27 | 18:11 | 120.8359375 | 69.15234375 | -7.46484375 | 14.6953125 | No | No |
| 28 | 18:16 | 115.6953125 | 67.7578125 | -12.60546875 | 13.30078125 | No | No |
| 29 | 18:21 | 110.0546875 | 65.72265625 | -18.24609375 | 11.265625 | No | No |
| 30 | 18:26 | 103.22265625 | 63.52734375 | -25.078125 | 9.0703125 | No | No |
| 31 | 18:31 | 95.6875 | 60.75390625 | -32.61328125 | 6.296875 | Yes | No |
| 32 | 18:36 | 87.8203125 | 58.546875 | -40.48046875 | 4.08984375 | Yes | No |
| 33 | 18:41 | 79.4453125 | 54.953125 | -48.85546875 | 0.49609375 | Yes | No |
| 34 | 18:46 | 69.13671875 | 51.72265625 | -59.1640625 | -2.734375 | Yes | No |
| 35 | 18:51 | 58.0 | 49.6015625 | -70.30078125 | -4.85546875 | Yes | No |
| 36 | 18:56 | 43.96484375 | 48.0078125 | -84.3359375 | -6.44921875 | Yes | No |
| 37 | 19:01 | 27.203125 | 47.0703125 | -101.09765625 | -7.38671875 | Yes | No |
| 38 | 19:06 | 2.5234375 | 46.37109375 | -125.77734375 | -8.0859375 | Yes | No |
| 39 | 19:11 | 15.33203125 | 47.0546875 | -112.96875 | -7.40234375 | Yes | No |
| 40 | 19:16 | 36.12890625 | 48.9453125 | -92.171875 | -5.51171875 | Yes | No |
| 41 | 19:21 | 50.5 | 49.34765625 | -77.80078125 | -5.109375 | Yes | No |
| 42 | 19:26 | 60.8984375 | 52.39453125 | -67.40234375 | -2.0625 | Yes | No |
| 43 | 19:31 | 70.91015625 | 54.6484375 | -57.390625 | 0.19140625 | Yes | No |
| 44 | 19:36 | 79.0 | 56.87109375 | -49.30078125 | 2.4140625 | Yes | No |
| 45 | 19:41 | 86.48828125 | 58.0546875 | -41.8125 | 3.59765625 | Yes | No |
| 46 | 19:46 | 91.765625 | 60.140625 | -36.53515625 | 5.68359375 | Yes | No |
| 47 | 19:51 | 97.50390625 | 63.0546875 | -30.796875 | 8.59765625 | Yes | No |
| 48 | 19:56 | 102.03125 | 64.26953125 | -26.26953125 | 9.8125 | No | No |
Florida is a comparison patch, not an unaffected causal control. Partial eclipse, clouds, solar geometry, display processing and compression can all contribute to its values. The contrast between these patches demonstrates the behavior of this chosen rule on this chosen movie; it does not isolate a physical cause for every pixel change.
What changes when the threshold or patch width changes?
Keep each patch centered at the same image position and test widths of 12, 16 and 20 pixels. At the Indianapolis-area location, each width produces 19 flags at a 20-unit threshold, 17 at 30 and 14 at 40. At the Florida location, only the 12-pixel patch at threshold 20 produces flags: six. The other eight Florida combinations produce none.
| Square width | Threshold | Indianapolis-area flags | Florida flags |
|---|---|---|---|
| 12 pixels | 20 display units | 19 | 6 |
| 12 pixels | 30 display units | 17 | 0 |
| 12 pixels | 40 display units | 14 | 0 |
| 16 pixels | 20 display units | 19 | 0 |
| 16 pixels | 30 display units | 17 | 0 |
| 16 pixels | 40 display units | 14 | 0 |
| 20 pixels | 20 display units | 19 | 0 |
| 20 pixels | 30 display units | 17 | 0 |
| 20 pixels | 40 display units | 14 | 0 |
The 18-combination table includes both regions. This is parameter sensitivity, not classifier validation.
Why darkening cannot become a land-change label by itself
The tested input is a rendered, compressed video. We did not retrieve calibrated ABI radiance or reflectance, construct a cloud mask, or estimate irradiance at the surface. A digital value falling close to zero does not translate into a measured percentage loss of sunlight.
The minimum at 19:06 UTC is likewise the minimum among the frames sampled for this patch. It is not a recovered eclipse contact time. Nor are the 17 flagged frames a measured false-positive rate: that would require a defined detection task and independent reference labels.
Compare the beginning and ending source frames
The result to carry into a change-detection workflow
A threshold can accurately report that a rendered image changed while leaving the cause unresolved. This eclipse sequence makes that distinction visible and testable. Before turning such a flag into a surface-change alert, account for illumination and the product’s processing, and seek task-appropriate evidence for the interpretation.
The original imagery and our derived values are provided for a historical, informational test. NOAA STAR’s product notice permits credited reuse and states that its hosted examples are not operational products. This article makes no operational detection or forecasting claim.