Launch Watch · imagery_literacy
Published
EPIC’s green Moon edge: inspect a real color-timing artifact
An untouched NASA EPIC frame and 31 reproducible RGB samples show what a colored edge can establish, and why display pixels are not raw sensor channels.
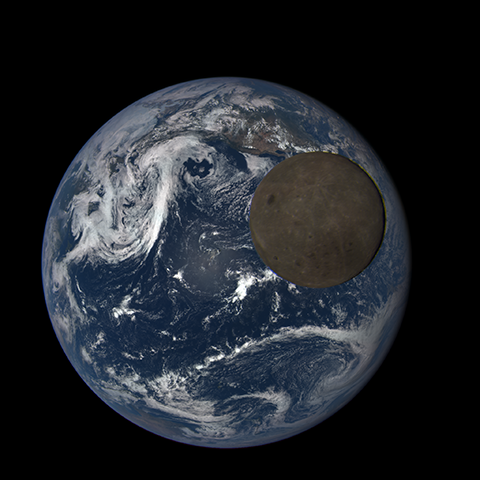
The Moon’s thin green edge in NASA’s July 2015 EPIC transit imagery is a good reason to ask how a color image was assembled before treating every visible color as a physical feature.
NASA explains the fringe as a consequence of the Moon moving between sequential exposures. Here is a small, reproducible inspection of one real gallery image: the untouched 480 × 480 browse frame, the precise row sampled, and all 31 RGB display values along that row.
Start with the real frame
The EPIC gallery identifies these as reprocessed images of the July 16, 2015 lunar transit, captured by NASA’s Earth Polychromatic Imaging Camera aboard NOAA’s DSCOVR spacecraft. It also explains that this view of the Moon crossing Earth is not a solar eclipse. The image below is the gallery’s browse PNG, retained byte-for-byte.
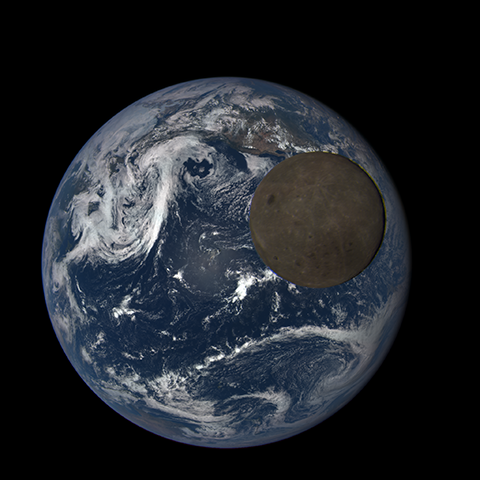
In its case explanation, NASA says the natural-color view combines separate monochrome exposures through red, blue and green filters. The component exposures were taken about 30 seconds apart. Lunar movement between them produced a green offset on the right and red/blue offsets on the left.
That provider explanation concerns the acquisition sequence. Our numerical inspection below concerns the already assembled public image. Keeping those two levels separate is essential: decoded PNG components are not the original instrument exposures.
Inspect one row without altering the evidence
The selected slice runs from x = 370 through x = 400 at y = 220, using zero-based coordinates from the top-left. It crosses the right-hand lunar edge in this displayed frame. The 31 positions are inclusive, so the sample count is 400 − 370 + 1.
Show the sampled row on a separately annotated view
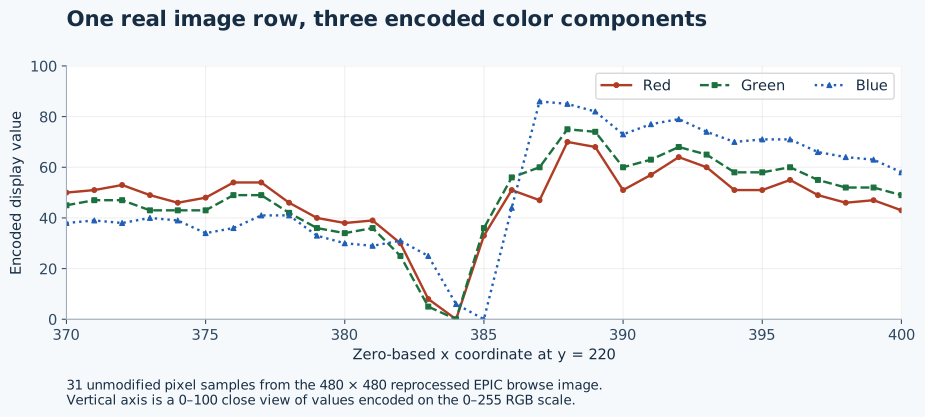
Three neighboring locations make the change tangible. At x = 384, the tuple is (0, 0, 6). At x = 385, it is (33, 36, 0). At x = 387, it is (47, 60, 86). The numbers are ordered red, green, blue.
Within this selected slice, the red and green minima occur at x = 384; the blue minimum occurs at x = 385. Those minima are separated by one pixel in this browse image. This is a reproducible property of the displayed file, not a measurement of the original sensor-channel displacement or the Moon’s speed.
Read all 31 sampled RGB values
| x | Red | Green | Blue |
|---|---|---|---|
| 370 | 50 | 45 | 38 |
| 371 | 51 | 47 | 39 |
| 372 | 53 | 47 | 38 |
| 373 | 49 | 43 | 40 |
| 374 | 46 | 43 | 39 |
| 375 | 48 | 43 | 34 |
| 376 | 54 | 49 | 36 |
| 377 | 54 | 49 | 41 |
| 378 | 46 | 42 | 41 |
| 379 | 40 | 36 | 33 |
| 380 | 38 | 34 | 30 |
| 381 | 39 | 36 | 29 |
| 382 | 30 | 25 | 31 |
| 383 | 8 | 5 | 25 |
| 384 | 0 | 0 | 6 |
| 385 | 33 | 36 | 0 |
| 386 | 51 | 56 | 44 |
| 387 | 47 | 60 | 86 |
| 388 | 70 | 75 | 85 |
| 389 | 68 | 74 | 82 |
| 390 | 51 | 60 | 73 |
| 391 | 57 | 63 | 77 |
| 392 | 64 | 68 | 79 |
| 393 | 60 | 65 | 74 |
| 394 | 51 | 58 | 70 |
| 395 | 51 | 58 | 71 |
| 396 | 55 | 60 | 71 |
| 397 | 49 | 55 | 66 |
| 398 | 46 | 52 | 64 |
| 399 | 47 | 52 | 63 |
| 400 | 43 | 49 | 58 |
What this little check establishes
The check can establish exactly what is in the retained browse image. Its SHA-256 digest is 103809b1917c6ec32766a40cb2398188ca948e8421a77a1556458a6f6f0f1057. Decoding that file as RGB, confirming its dimensions, and reading the listed coordinates reproduces the table and minima.
It cannot turn those encoded values into calibrated radiance or physical lunar color. The file is a reprocessed, reduced-size public rendering, and no raw channels or per-filter timestamp record are part of this inspection. We therefore do not infer precise exposure times from its filename, measure a transit speed or estimate the duration of the whole event.
NASA’s specific timing explanation makes this a useful case study, but it is not a universal diagnosis for every colored edge. Other imagery needs its own acquisition and processing documentation before the same explanation is applied.
A better first question for unusual image colors
Ask whether the visible color components were acquired at the same instant, then ask which processing stage you are looking at. If you only have a public RGB rendering, preserve that limitation alongside any pixel measurements.
For this EPIC frame, the useful conclusion is straightforward: a real moving subject, photographed through sequential filters, can leave a colored fringe in an assembled image. The original file and the small transect let a reader inspect the display evidence, while NASA’s acquisition account explains why the feature should not be read as a green lunar surface.