Launch Watch · Evidence study
Published
Harvey at Rosharon: why a week-late Landsat image still caught high water
A 32-day USGS river record explains why the September 5, 2017 Landsat image still showed high water seven days after the highest daily mean.
A week after the highest daily mean in this Rosharon river record, the water level had fallen only 1.02 feet. That is the missing context behind a striking Landsat image from September 5, 2017: the scene arrived late by the calendar, but it still sampled a prolonged high-water period after Hurricane Harvey.
We reconstructed 32 days of approved USGS gage-height data and joined the two Landsat image dates to that series. The result changes how to read the pair. The later image shows persistent flooding along the Brazos corridor; its date alone does not establish how much the river had receded or whether the image captured maximum inundation.
Start with the river record
The USGS station near Rosharon, Texas is USGS-08116650. We used parameter 00065, gage height, and statistic 00003, daily mean, for August 12 through September 12, 2017. All 32 retained observations are marked Approved, with units of feet. There are no missing reporting dates or duplicate dates in that interval.
The highest daily mean in this defined window is 52.54 feet on August 29. September 5, the calendar date of the later Landsat image, has a daily mean of 51.52 feet. Subtraction gives 52.54 − 51.52 = 1.02 feet over seven calendar days. These are elevations relative to the station’s gage datum, not floodwater depths over the surrounding land. The complete values are available in the 32-row data table.
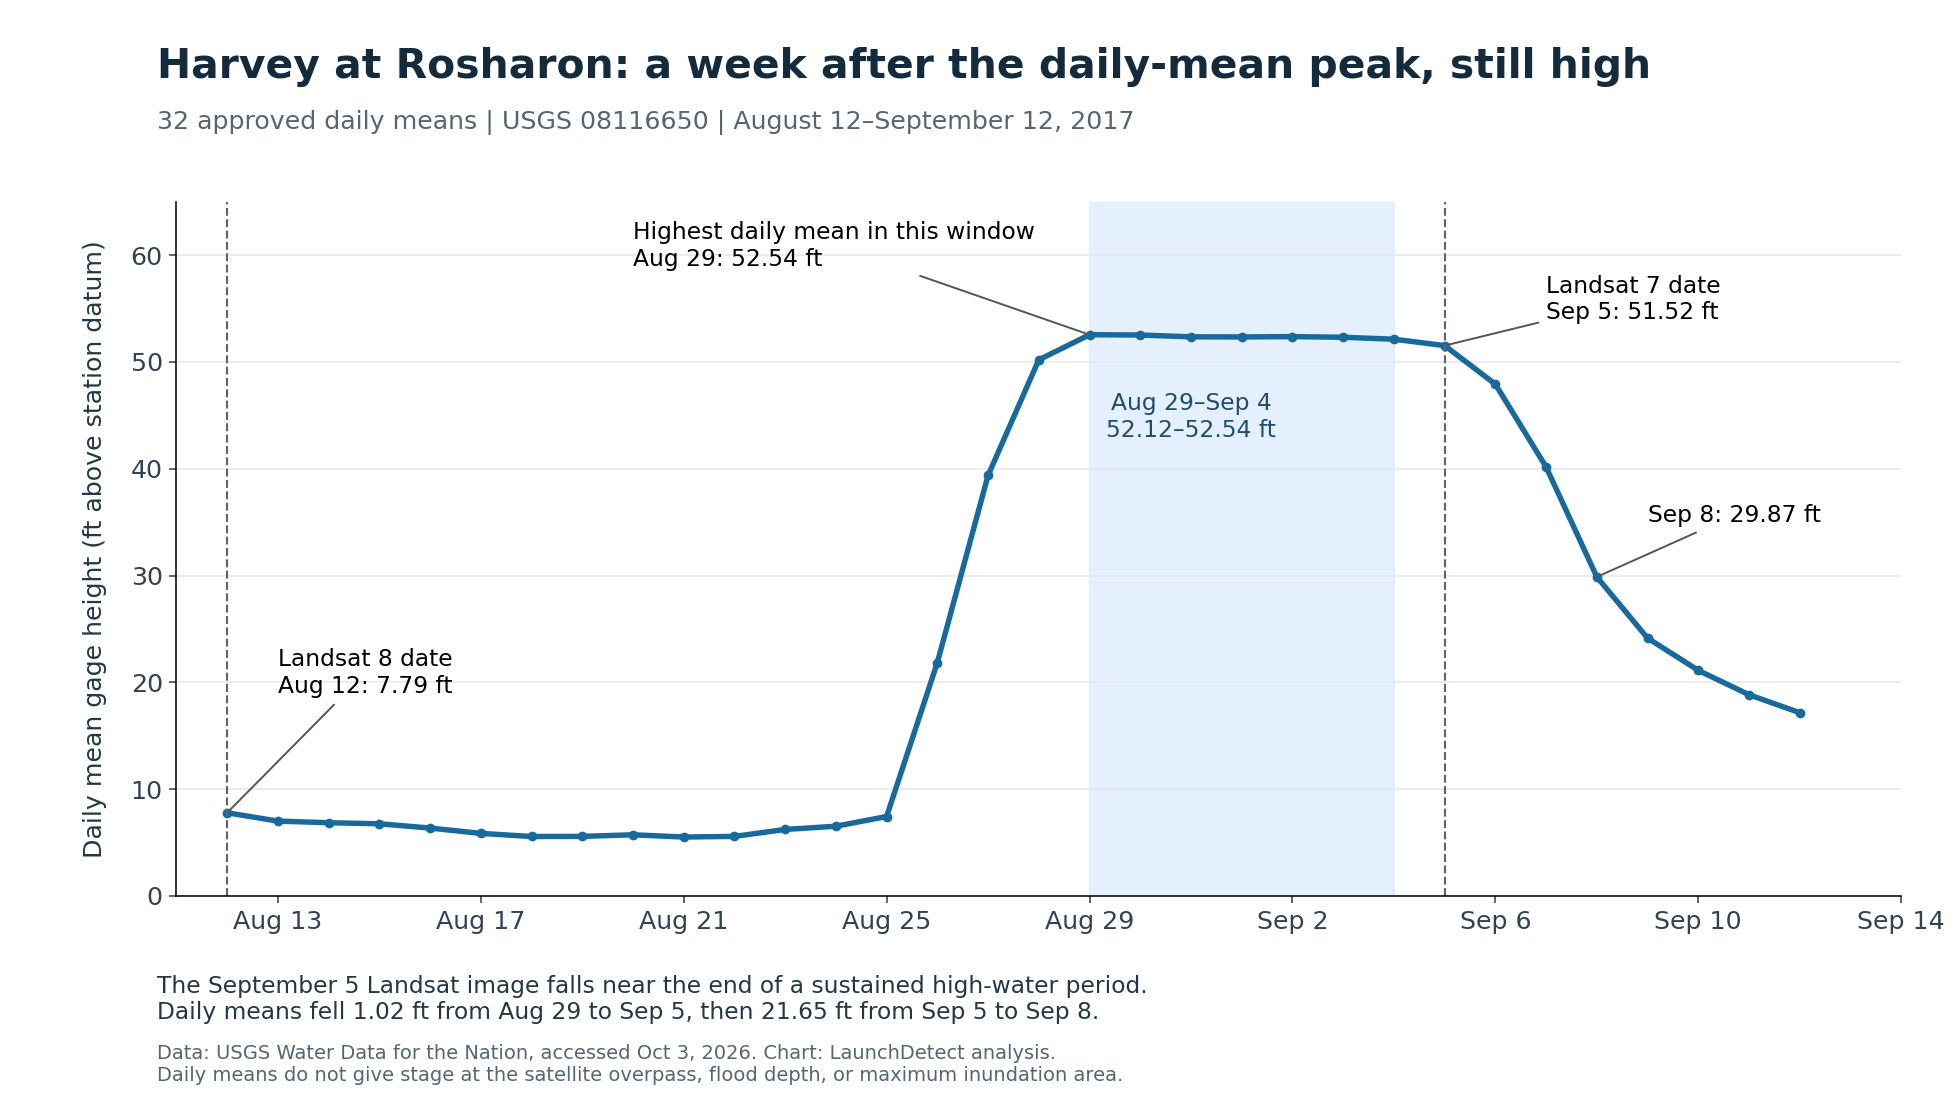
Look at the intervening days before interpreting the seven-day gap. From August 29 through September 4, the seven daily means span just 52.12 to 52.54 feet. Their range is 0.42 feet. We call that selected interval a high-water plateau as a description of this series, without treating it as an official flood-stage threshold.
The sharper decline comes afterward. September 5 to September 8 falls from 51.52 to 29.87 feet: a drop of 21.65 feet in three calendar days. Thus, at this station, the Landsat date falls near the end of sustained high water and before the much larger decline visible in the following days.
| Reporting date | Daily mean gage height | Why it matters |
|---|---|---|
| August 12, 2017 | 7.79 ft | Before-image date |
| August 29, 2017 | 52.54 ft | Highest daily mean in the 32-day window |
| September 5, 2017 | 51.52 ft | After-image date |
| September 8, 2017 | 29.87 ft | Subsequent recession |
What the two Landsat views add
The USGS EROS image pair shows the Brazos River corridor near Rosharon and toward Freeport. The first view is labeled Landsat 8, August 12, 2017; the second is Landsat 7, September 5, 2017. They are 24 calendar days apart.
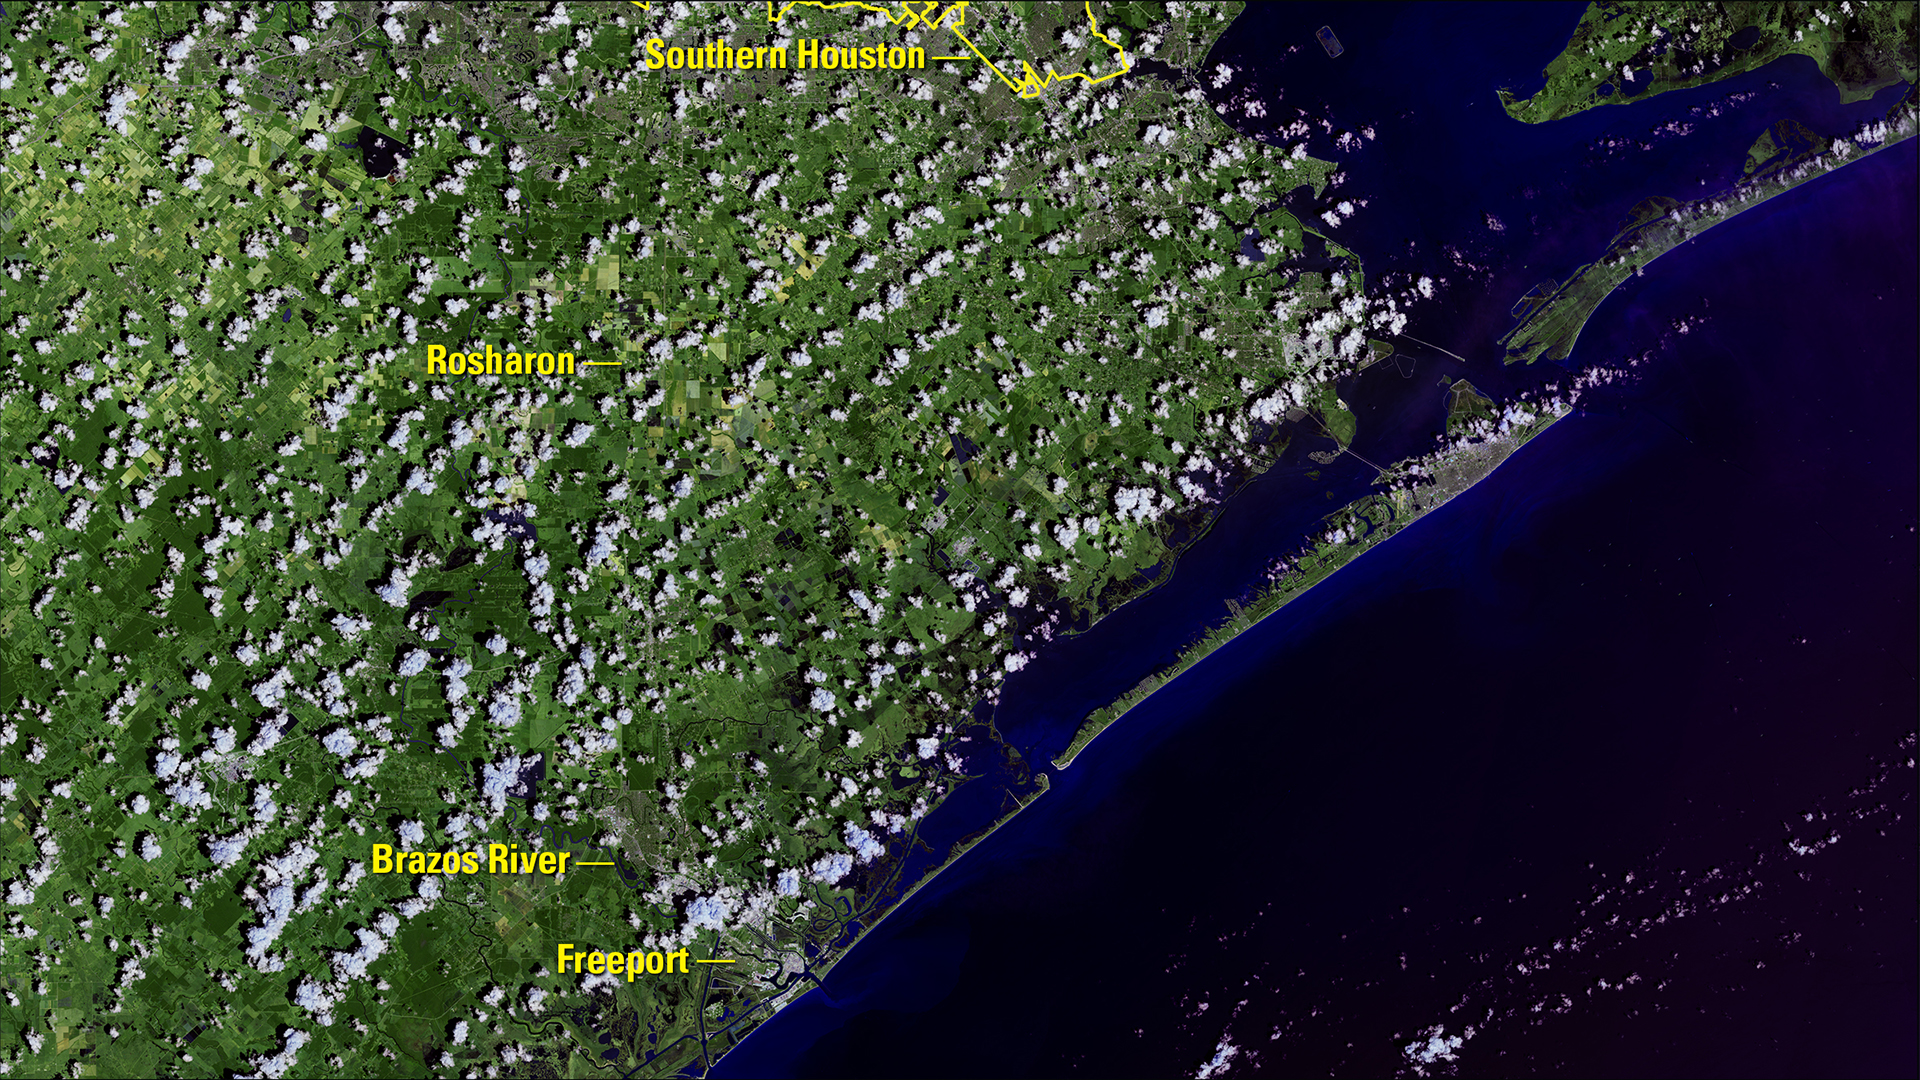
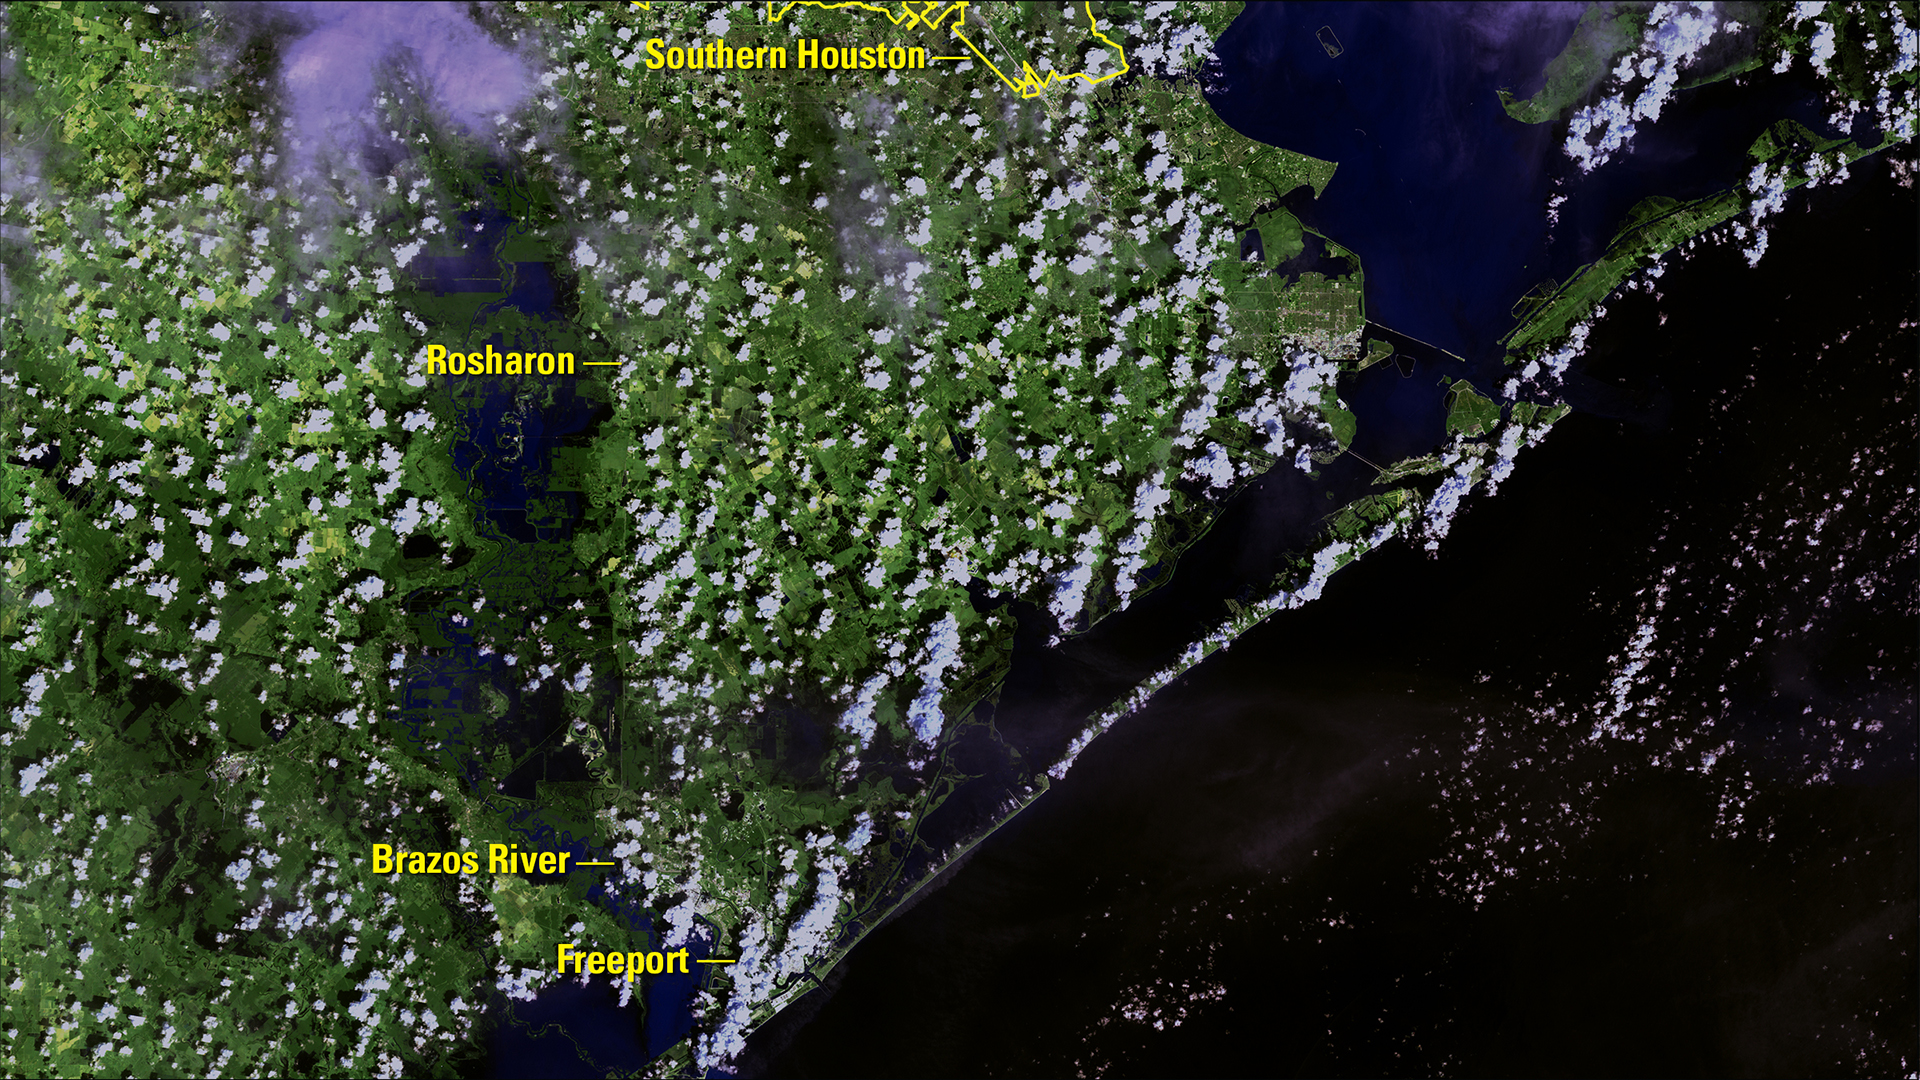
In the after view, a broad dark inundated corridor is conspicuous below and around the Rosharon label, continuing south toward Freeport. In the earlier view, the river is much narrower against surrounding fields and vegetation. Clouds obscure parts of both scenes, so the comparison remains qualitative.
The hydrograph gives that visual difference a time context. A scene taken seven days after the highest daily mean can still show extensive high water when the river level stays elevated. The date gap would be misleading if read as seven days of substantial recession.
Why the before image is August 12, despite its original filename
The source JPEG filename contains “Aug-2,” but the official EROS downloadable presentation explicitly labels the same scene August 12, 2017. That date agrees with the USGS feature and the independently published Texas and Landsat fact sheet. We use the agency’s visible date label, rather than infer an acquisition date from a storage filename. Exact Landsat scene identifiers were not verified for this provider-image comparison.
Three quantities that should stay separate
USGS’s account of the flooding reports an instantaneous crest of 52.65 feet on August 29. Our series gives that day’s mean as 52.54 feet. The two values describe different statistics and should not be substituted for each other.
The daily mean on September 5 is also not a measurement at the satellite’s exact overpass time. Joining a scene date to a daily summary supports a calendar-day comparison. It does not create an instantaneous coincident observation.
Finally, one point gage cannot establish the flood depth, timing or extent everywhere in an image. We did not derive flooded acreage, affected buildings, discharge or damage from the rendered JPEGs. Nor did we classify raw Landsat pixels or establish the maximum flood footprint.
Reproduce the useful comparison
The exact USGS data query selects the station, date interval, parameter and daily-mean statistic. Preserve the source reporting dates, sort them, check the units and approval flags, and calculate the three differences: 1.02 feet from August 29 to September 5, a 0.42-foot range across August 29–September 4, and 21.65 feet from September 5 to September 8.
For this historical pair, those simple calculations are more informative than counting days since a crest. Before calling a flood image “late,” look at the river’s observed trajectory. Here, the Landsat view documents water that remained high, while the later gage readings show when the substantial recession followed.