Launch Watch · Evidence study
Published
Lake Mead’s 276 monthly readings: what elevation can tell us
An audit of Lake Mead’s 2000–2022 monthly elevations finds a 169.44-foot endpoint decline, 111 rises and clear limits on storage claims.
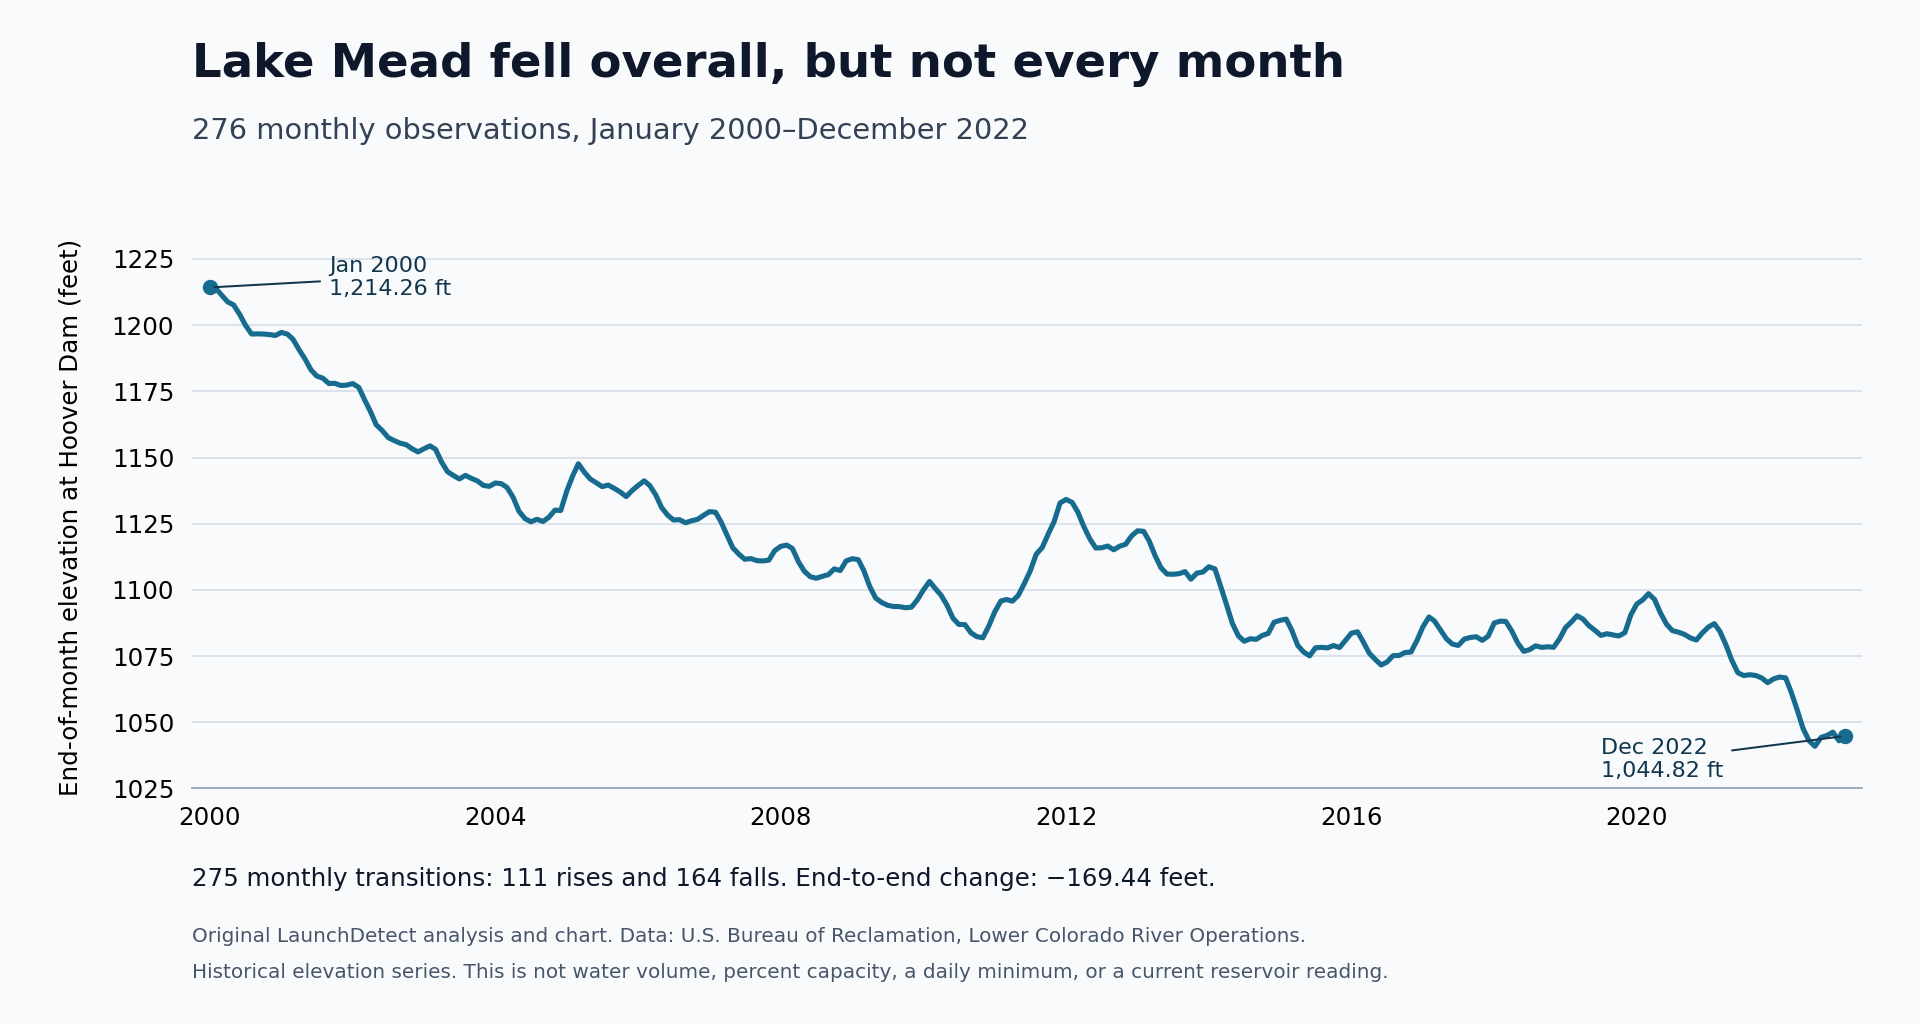
Lake Mead ended January 2000 at 1,214.26 feet and December 2022 at 1,044.82 feet. Between those endpoints, its recorded month-end elevation rose 111 times and fell 164 times. Both findings matter: a long decline can contain many shorter recoveries.
We reconstructed all 276 monthly readings for 2000–2022 from the Bureau of Reclamation’s Lake Mead elevation table, then checked every adjacent pair. The result is a historical elevation audit, with the complete data available below.
Three questions, three calculations
How much did the elevation change across the whole series? Subtract the first value from the last: 1,044.82 − 1,214.26 = −169.44 feet. That answers a precisely bounded question about January 2000 through December 2022.
How much lower was one July than the other? July 2022 minus July 2000 gives 1,040.92 − 1,199.97 = −159.05 feet. Comparing the same month holds the calendar month fixed, but does not isolate a cause. It also answers a different question from the full-series endpoint calculation.
Did the lake rise after the lowest month in this series? December 2022 stood 3.90 feet above July 2022. That local increase coexists with the much larger decline from January 2000. The answer changes when the interval changes; the data have not contradicted themselves.
| Month | Elevation (feet) | Role in this analysis |
|---|---|---|
| January 2000 | 1,214.26 | First and highest month-end in this series |
| July 2000 | 1,199.97 | Start of the July-to-July comparison |
| July 2022 | 1,040.92 | Lowest month-end in this series |
| December 2022 | 1,044.82 | Last month-end in this series |
Counting rises without losing the larger change
A series of 276 observations has 275 adjacent transitions. For each transition, we subtract the previous month’s value from the next month’s value, keeping the hundredth-foot values supplied by Reclamation. Positive differences count as rises; negative differences count as falls. No pair has an unchanged value at the source’s displayed precision.
The resulting 111 rises and 164 falls describe the direction of each monthly step. They do not describe how much water entered or left the reservoir, and they give every transition one count regardless of its size. An increase of a few hundredths of a foot and a much larger increase each count once. To understand the total change, retain the actual differences as well as their signs.
Check the full monthly table and calculation method
The table has 23 consecutive years and 12 entries per year, with no missing month in this selected interval. Read each row from January through December. The transition from December to the next January is included in the 275-pair calculation. Download all 276 readings as CSV.
| Year | Jan | Feb | Mar | Apr | May | Jun | Jul | Aug | Sep | Oct | Nov | Dec |
|---|---|---|---|---|---|---|---|---|---|---|---|---|
| 2000 | 1214.26 | 1213.79 | 1211.33 | 1208.78 | 1207.67 | 1204.09 | 1199.97 | 1196.66 | 1196.72 | 1196.66 | 1196.45 | 1196.12 |
| 2001 | 1197.27 | 1196.62 | 1194.68 | 1190.76 | 1187.32 | 1183.12 | 1180.78 | 1179.97 | 1177.96 | 1178.03 | 1177.22 | 1177.37 |
| 2002 | 1177.94 | 1176.50 | 1172.06 | 1167.49 | 1162.39 | 1160.19 | 1157.57 | 1156.42 | 1155.42 | 1154.89 | 1153.30 | 1152.13 |
| 2003 | 1153.33 | 1154.42 | 1153.09 | 1148.27 | 1144.68 | 1143.19 | 1141.93 | 1143.27 | 1142.12 | 1141.17 | 1139.48 | 1139.12 |
| 2004 | 1140.39 | 1140.11 | 1138.70 | 1134.98 | 1129.70 | 1126.93 | 1125.73 | 1126.67 | 1125.86 | 1127.43 | 1130.13 | 1130.01 |
| 2005 | 1137.40 | 1143.25 | 1147.66 | 1144.45 | 1141.89 | 1140.46 | 1139.01 | 1139.61 | 1138.36 | 1137.01 | 1135.27 | 1137.52 |
| 2006 | 1139.46 | 1141.20 | 1139.48 | 1135.94 | 1131.14 | 1128.26 | 1126.42 | 1126.54 | 1125.36 | 1126.13 | 1126.63 | 1128.12 |
| 2007 | 1129.55 | 1129.35 | 1125.79 | 1120.69 | 1115.89 | 1113.50 | 1111.58 | 1111.84 | 1111.06 | 1110.95 | 1111.22 | 1114.81 |
| 2008 | 1116.46 | 1116.93 | 1115.65 | 1110.61 | 1107.05 | 1104.98 | 1104.42 | 1105.13 | 1105.76 | 1107.94 | 1107.33 | 1110.97 |
| 2009 | 1111.78 | 1111.43 | 1107.40 | 1101.26 | 1096.92 | 1095.26 | 1094.20 | 1093.73 | 1093.68 | 1093.26 | 1093.52 | 1096.30 |
| 2010 | 1100.02 | 1103.21 | 1100.66 | 1098.00 | 1094.30 | 1089.30 | 1086.97 | 1086.91 | 1083.81 | 1082.36 | 1081.94 | 1086.30 |
| 2011 | 1091.73 | 1095.78 | 1096.39 | 1095.76 | 1097.90 | 1102.38 | 1107.07 | 1113.45 | 1116.04 | 1121.00 | 1125.82 | 1132.83 |
| 2012 | 1134.18 | 1133.06 | 1129.41 | 1123.93 | 1119.38 | 1115.84 | 1115.92 | 1116.56 | 1115.16 | 1116.50 | 1117.24 | 1120.36 |
| 2013 | 1122.32 | 1122.14 | 1118.59 | 1112.91 | 1108.36 | 1105.98 | 1105.92 | 1106.13 | 1106.92 | 1104.04 | 1106.36 | 1106.73 |
| 2014 | 1108.75 | 1107.94 | 1101.71 | 1094.55 | 1087.46 | 1082.66 | 1080.60 | 1081.55 | 1081.33 | 1082.79 | 1083.57 | 1087.79 |
| 2015 | 1088.51 | 1088.98 | 1084.87 | 1079.03 | 1076.57 | 1075.08 | 1078.15 | 1078.31 | 1078.10 | 1078.99 | 1078.23 | 1080.91 |
| 2016 | 1083.68 | 1084.17 | 1080.45 | 1076.13 | 1073.80 | 1071.64 | 1072.75 | 1075.17 | 1075.23 | 1076.34 | 1076.55 | 1080.82 |
| 2017 | 1086.08 | 1089.78 | 1088.26 | 1084.89 | 1081.56 | 1079.52 | 1079.03 | 1081.44 | 1082.05 | 1082.30 | 1080.95 | 1082.52 |
| 2018 | 1087.50 | 1088.21 | 1088.11 | 1084.49 | 1080.00 | 1076.81 | 1077.43 | 1078.88 | 1078.29 | 1078.52 | 1078.32 | 1081.46 |
| 2019 | 1085.75 | 1087.97 | 1090.24 | 1088.95 | 1086.48 | 1084.71 | 1082.82 | 1083.45 | 1083.00 | 1082.61 | 1083.85 | 1090.49 |
| 2020 | 1094.68 | 1096.27 | 1098.59 | 1096.39 | 1091.32 | 1087.07 | 1084.63 | 1084.04 | 1083.21 | 1081.88 | 1081.07 | 1083.72 |
| 2021 | 1085.95 | 1087.26 | 1084.39 | 1079.30 | 1073.50 | 1068.77 | 1067.65 | 1067.96 | 1067.68 | 1066.77 | 1064.97 | 1066.39 |
| 2022 | 1067.09 | 1066.78 | 1061.49 | 1054.69 | 1047.69 | 1043.02 | 1040.92 | 1044.28 | 1045.03 | 1046.28 | 1043.02 | 1044.82 |
To reproduce the count, sort by year and month, calculate next month minus previous month, and count positive, negative and zero results. The supplied data preserve the source’s displayed precision; that is not a claim of measurement accuracy to one hundredth of a foot.
Why elevation cannot give a storage percentage
Elevation locates the water surface relative to a vertical reference. It is not a measurement from the lakebed, and it is not stored-water volume. Dividing the two endpoint elevations would mix that reference level into the result. It would not reveal the fraction of the reservoir’s water that was lost.
A defensible storage calculation needs the reservoir’s elevation–storage relationship, an appropriate capacity definition and the relevant dates. A reservoir’s shape changes the amount of volume represented by a foot of elevation. Those inputs are outside this monthly elevation audit, so we do not attach a volume-loss or percent-capacity number to the chart.
Use the interval in the sentence
A concise description supported by these data is: “Lake Mead’s month-end elevation fell 169.44 feet from January 2000 to December 2022, with 111 monthly increases within that interval.” Calling July 2022 the lowest month-end in this 2000–2022 series is also supported.
The series does not establish a daily or all-time minimum, assign causes to individual changes, predict later levels, or describe current conditions. For a new comparison, start with the authoritative table again, state both endpoints and keep elevation, storage and capacity in separate columns.