Launch Watch · Earth
Published
Mauna Loa in two satellite views: a bright-light artifact and a color-scale ceiling
A Mauna Loa night image has a recovery streak; an SO₂ map ends at 100 DU. Compare the instruments, printed values and eleven-hour timing gap.
A dark streak runs southeast from Mauna Loa’s brilliant glow in a nighttime satellite image. In a separate map, sulfur dioxide reaches the darkest end of a 0–100 Dobson Unit color scale. Both can invite the word “saturation,” but the evidence points to two different questions: how a detector recovered from intense light, and how a map chose to display gas-column values.
The November 2022 eruption gives us a useful real case. NASA Earth Observatory’s image story places the nighttime image and sulfur-dioxide map together. Reading their instruments, units and times separately changes what we can infer from the pair.
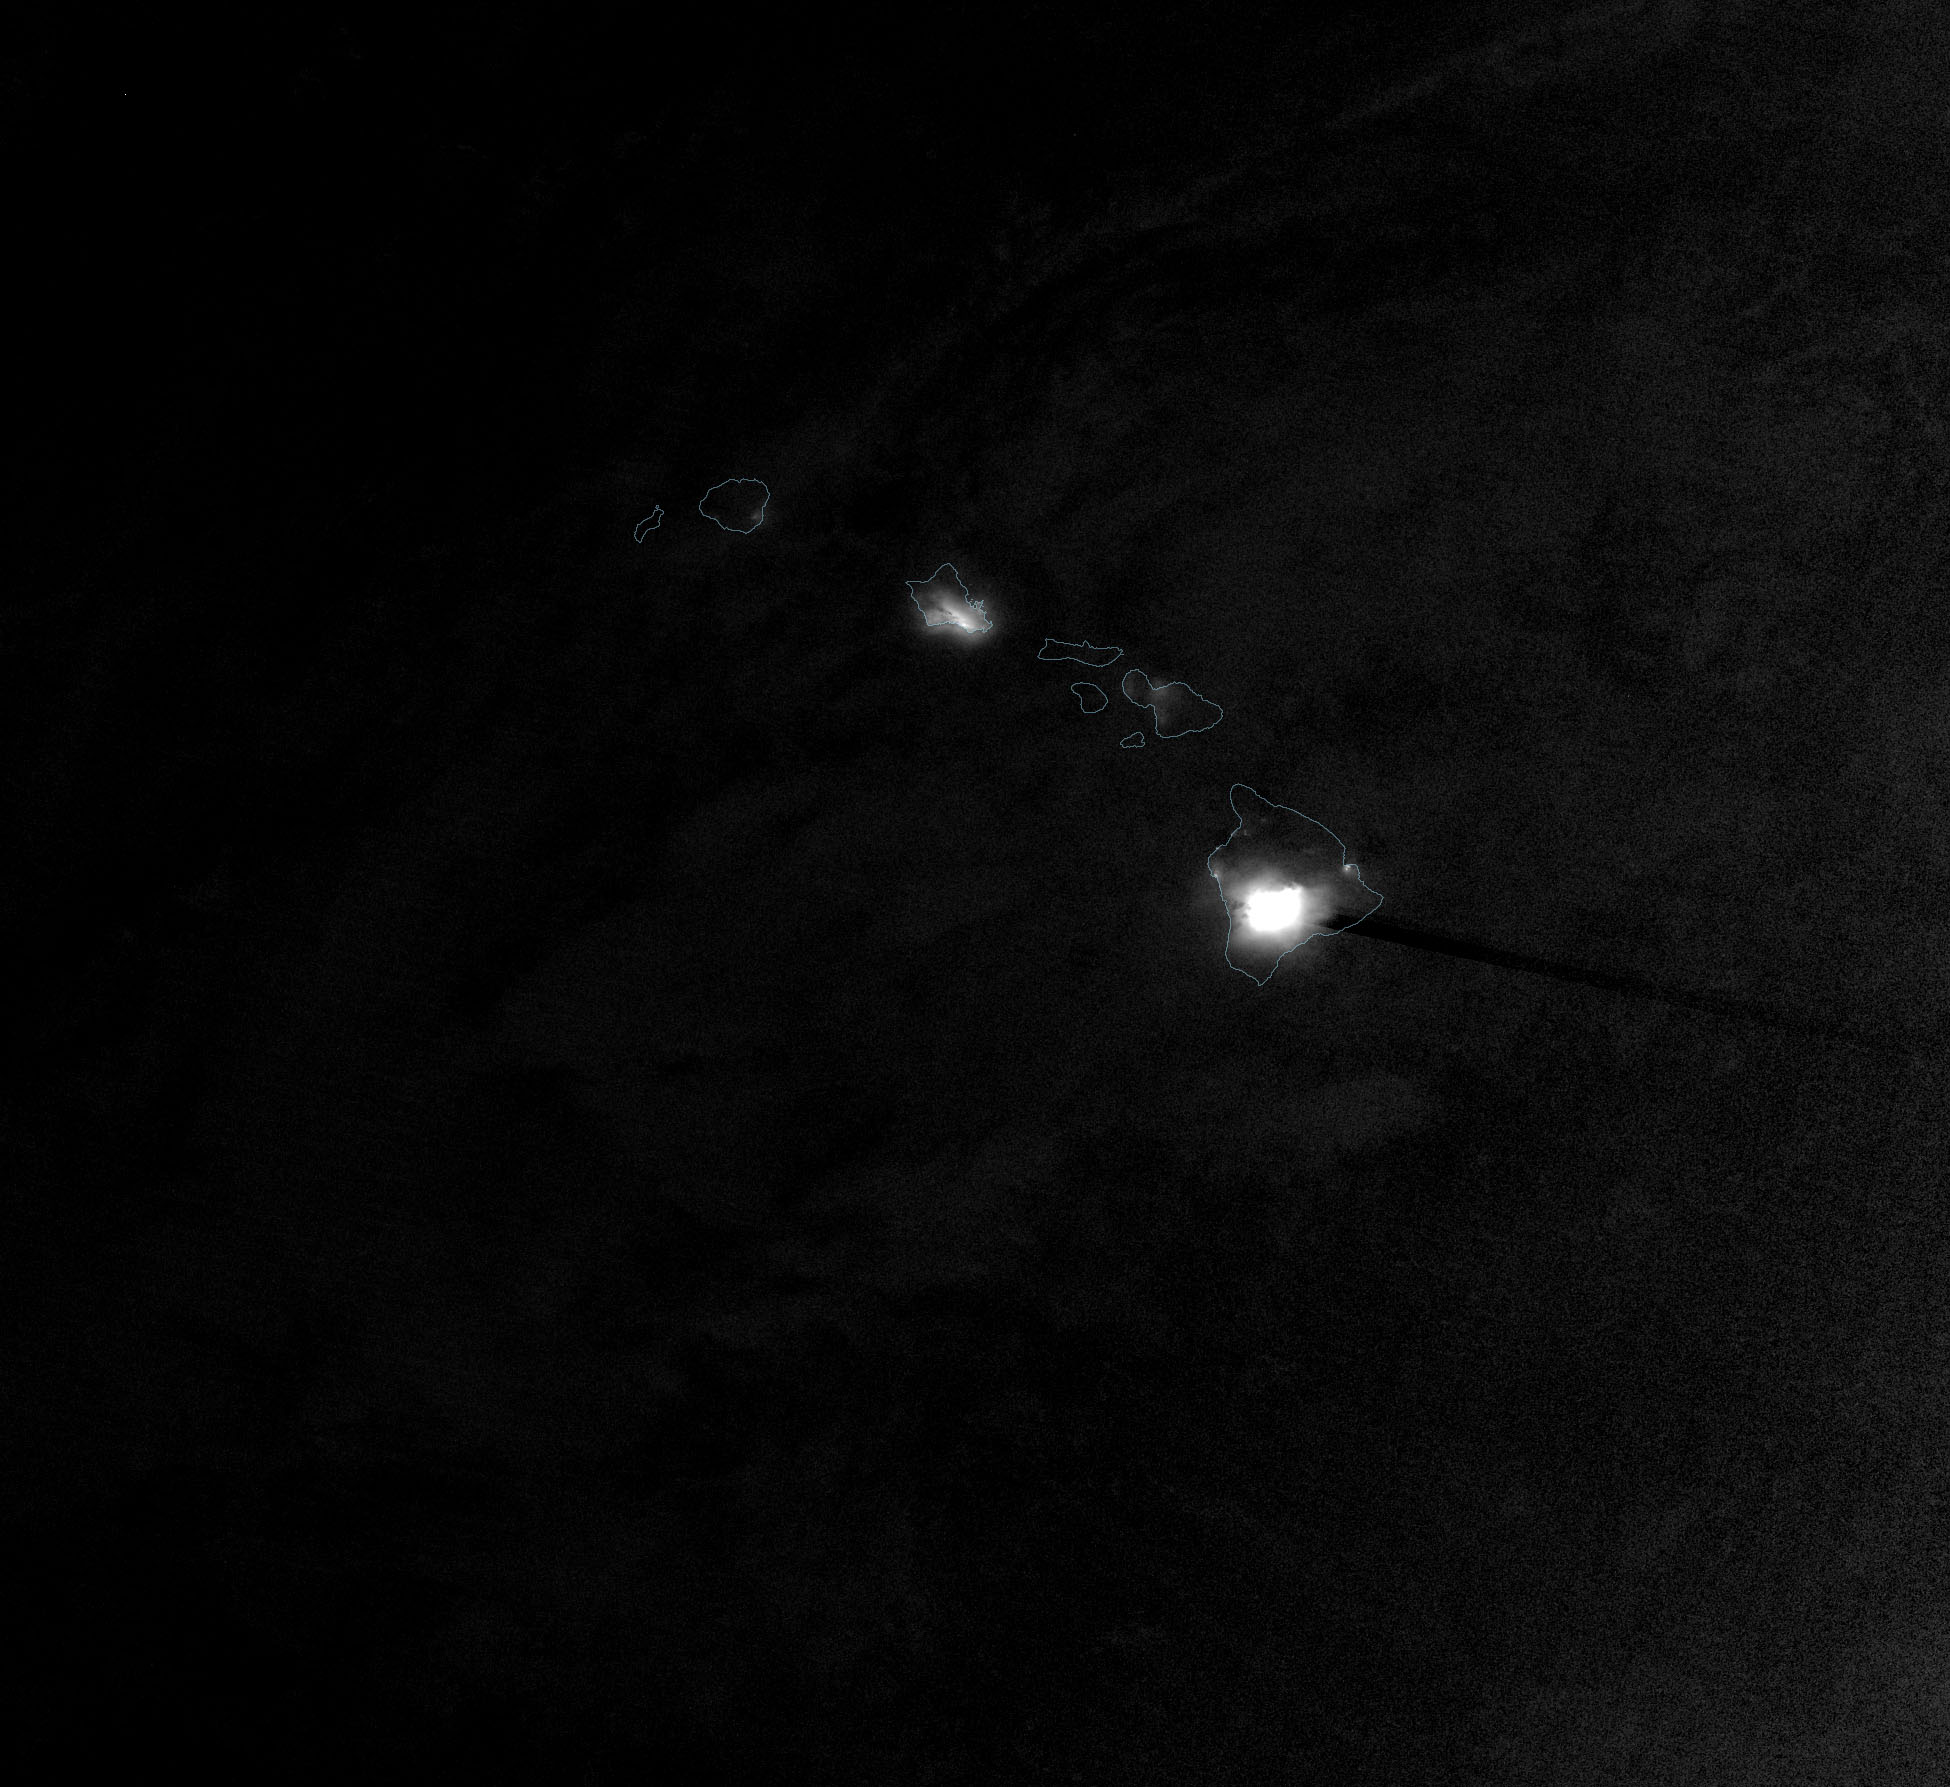
The nighttime streak has an instrument explanation
Suomi NPP’s VIIRS day-night band acquired the eruption image at 12:25 UTC on 28 November 2022, or 2:25 a.m. in Hawaii. NASA explains that clouds scattered light from the eruption and urban areas. In the same account, volcanologist Simon Carn interprets the dark line as a likely “post-saturation recovery streak” along the instrument’s scan after viewing an exceptionally intense visible-light source.
That is a specific detector-response interpretation. The streak is not a dark lava flow to trace across the ocean. The diffuse bright patch also should not be outlined and reported as a measured lava footprint: light scattered by clouds can spread beyond the emitting source.
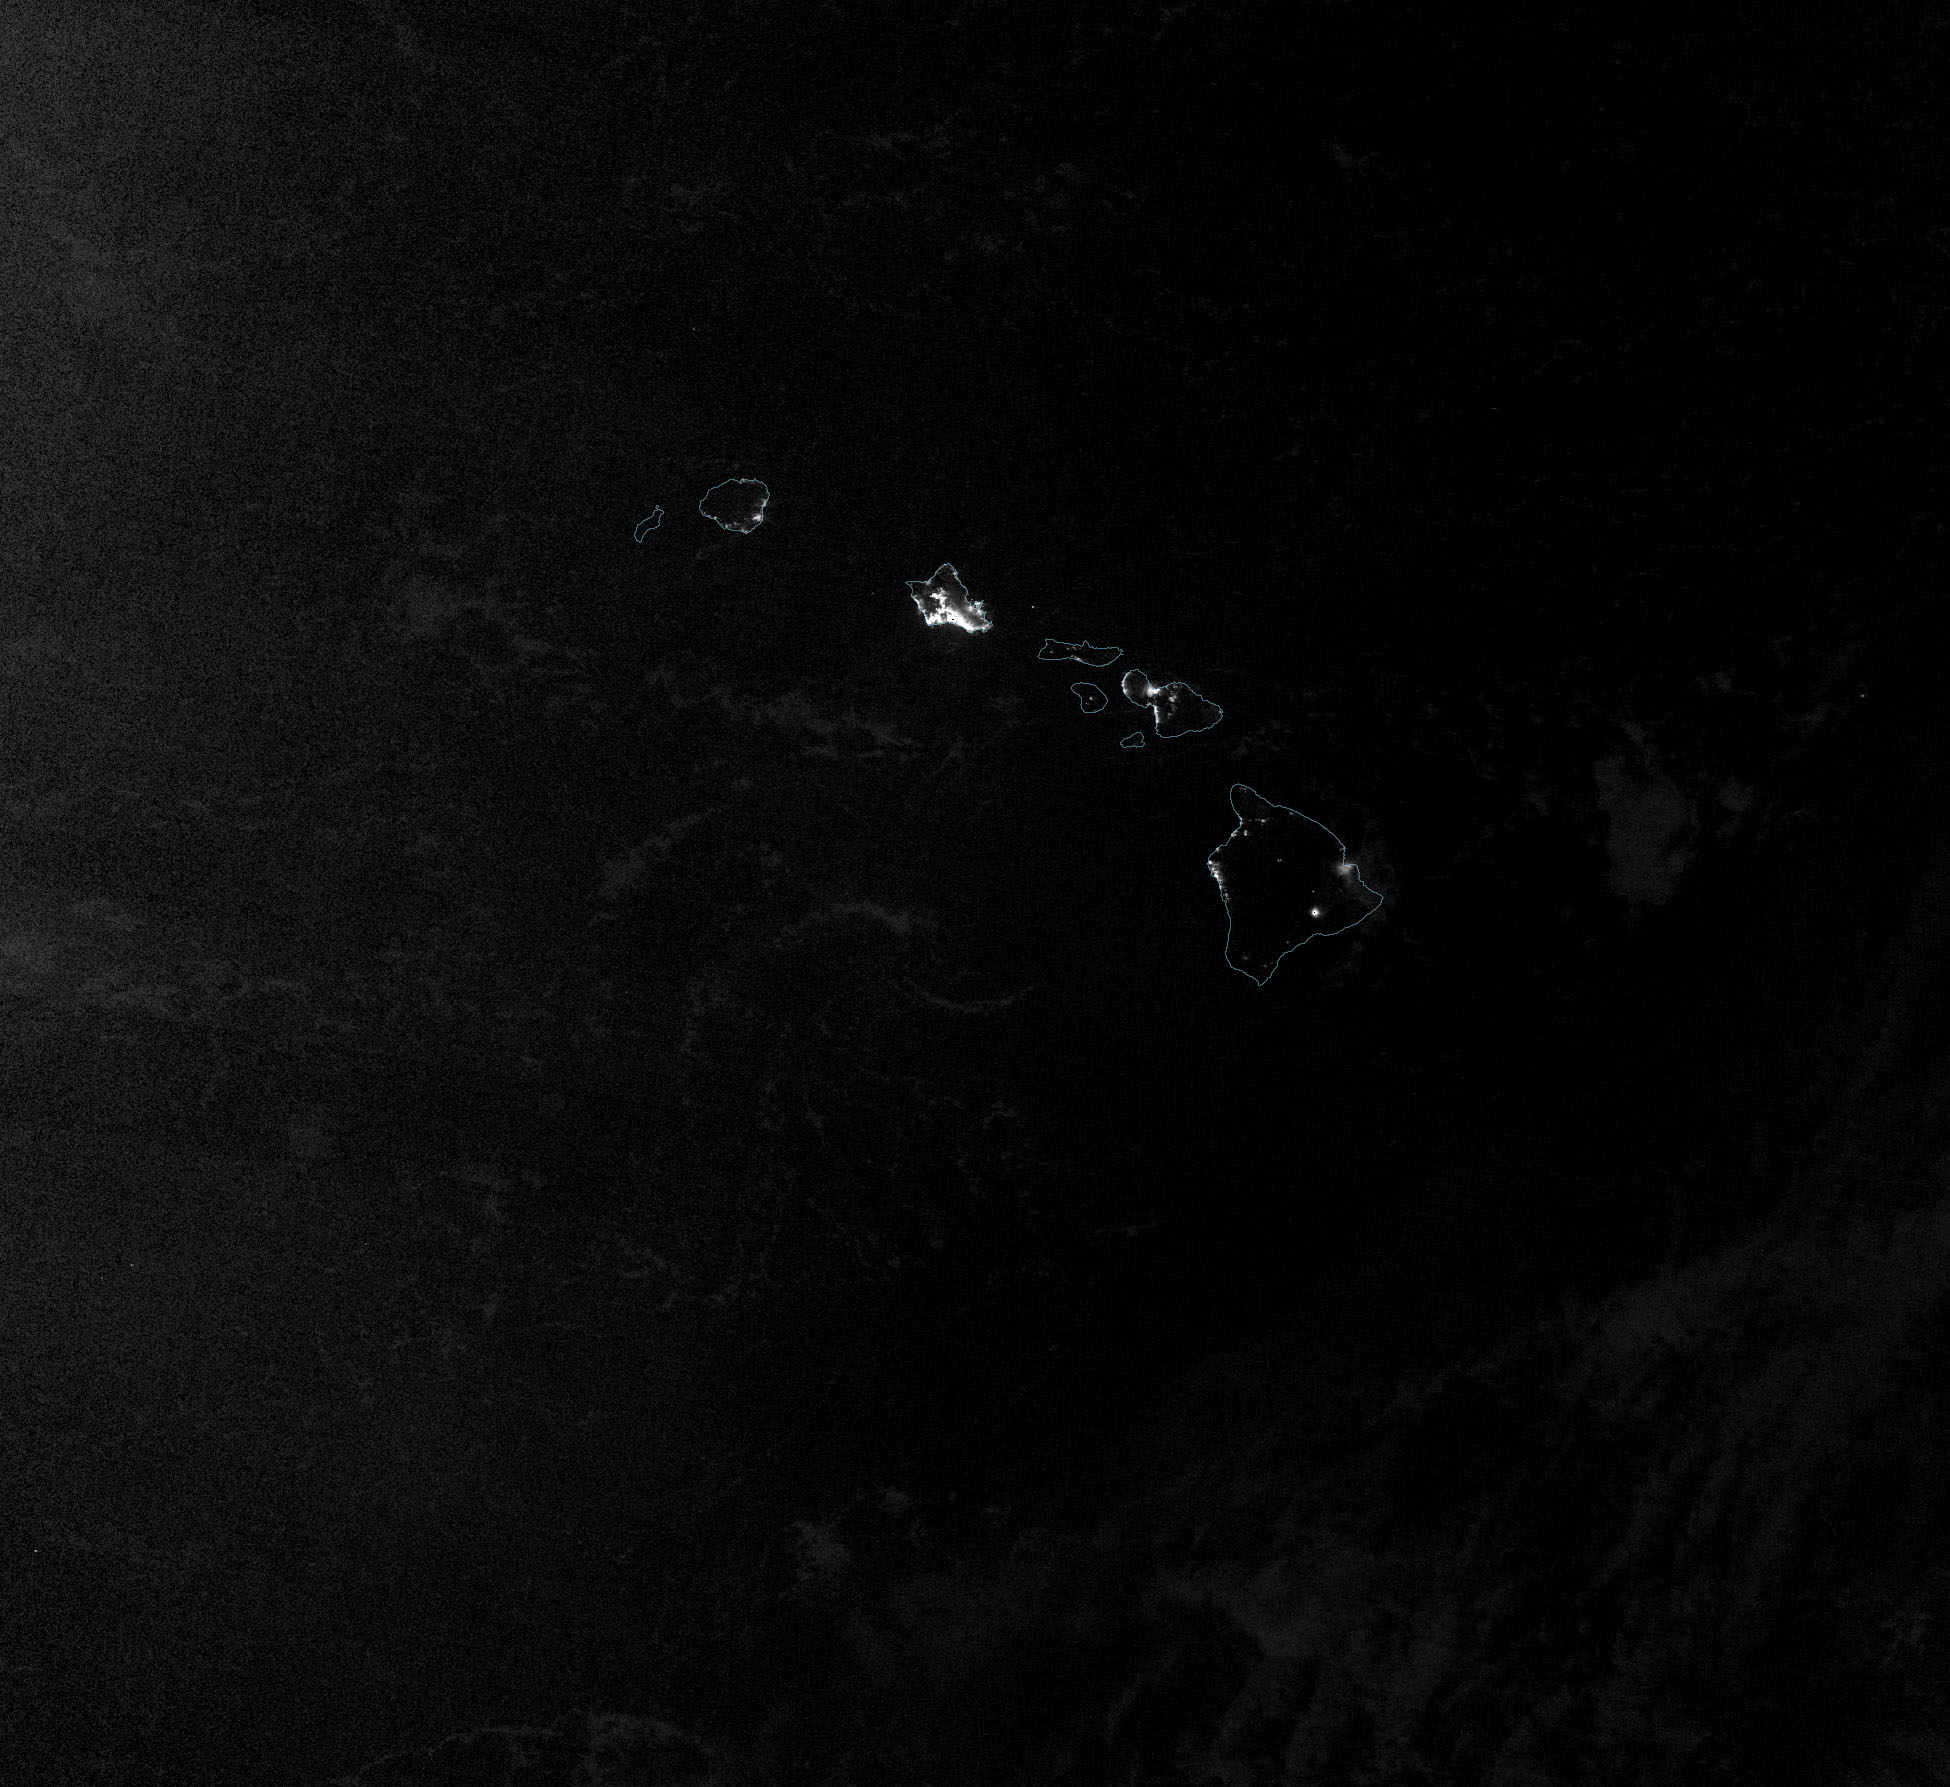
NASA provides a 29 October image for comparison. It helps show the scene before this eruption, but the pair is not a controlled radiometric experiment. We have not corrected cloud effects, retrieved calibrated radiance or estimated the physical area of new lava from either rendered image.
View NASA’s pre-eruption nighttime comparison
The gas map’s upper color is a display endpoint
The SO₂ map uses a different instrument and quantity. Sentinel-5P’s TROPOMI retrieves sulfur-dioxide columns; the Earth Observatory legend identifies a middle-troposphere product and expresses it in Dobson Units. DU describes a column amount, rather than nighttime brightness or surface temperature. NASA’s TROPOMI gallery provides the product context and unit explanation.
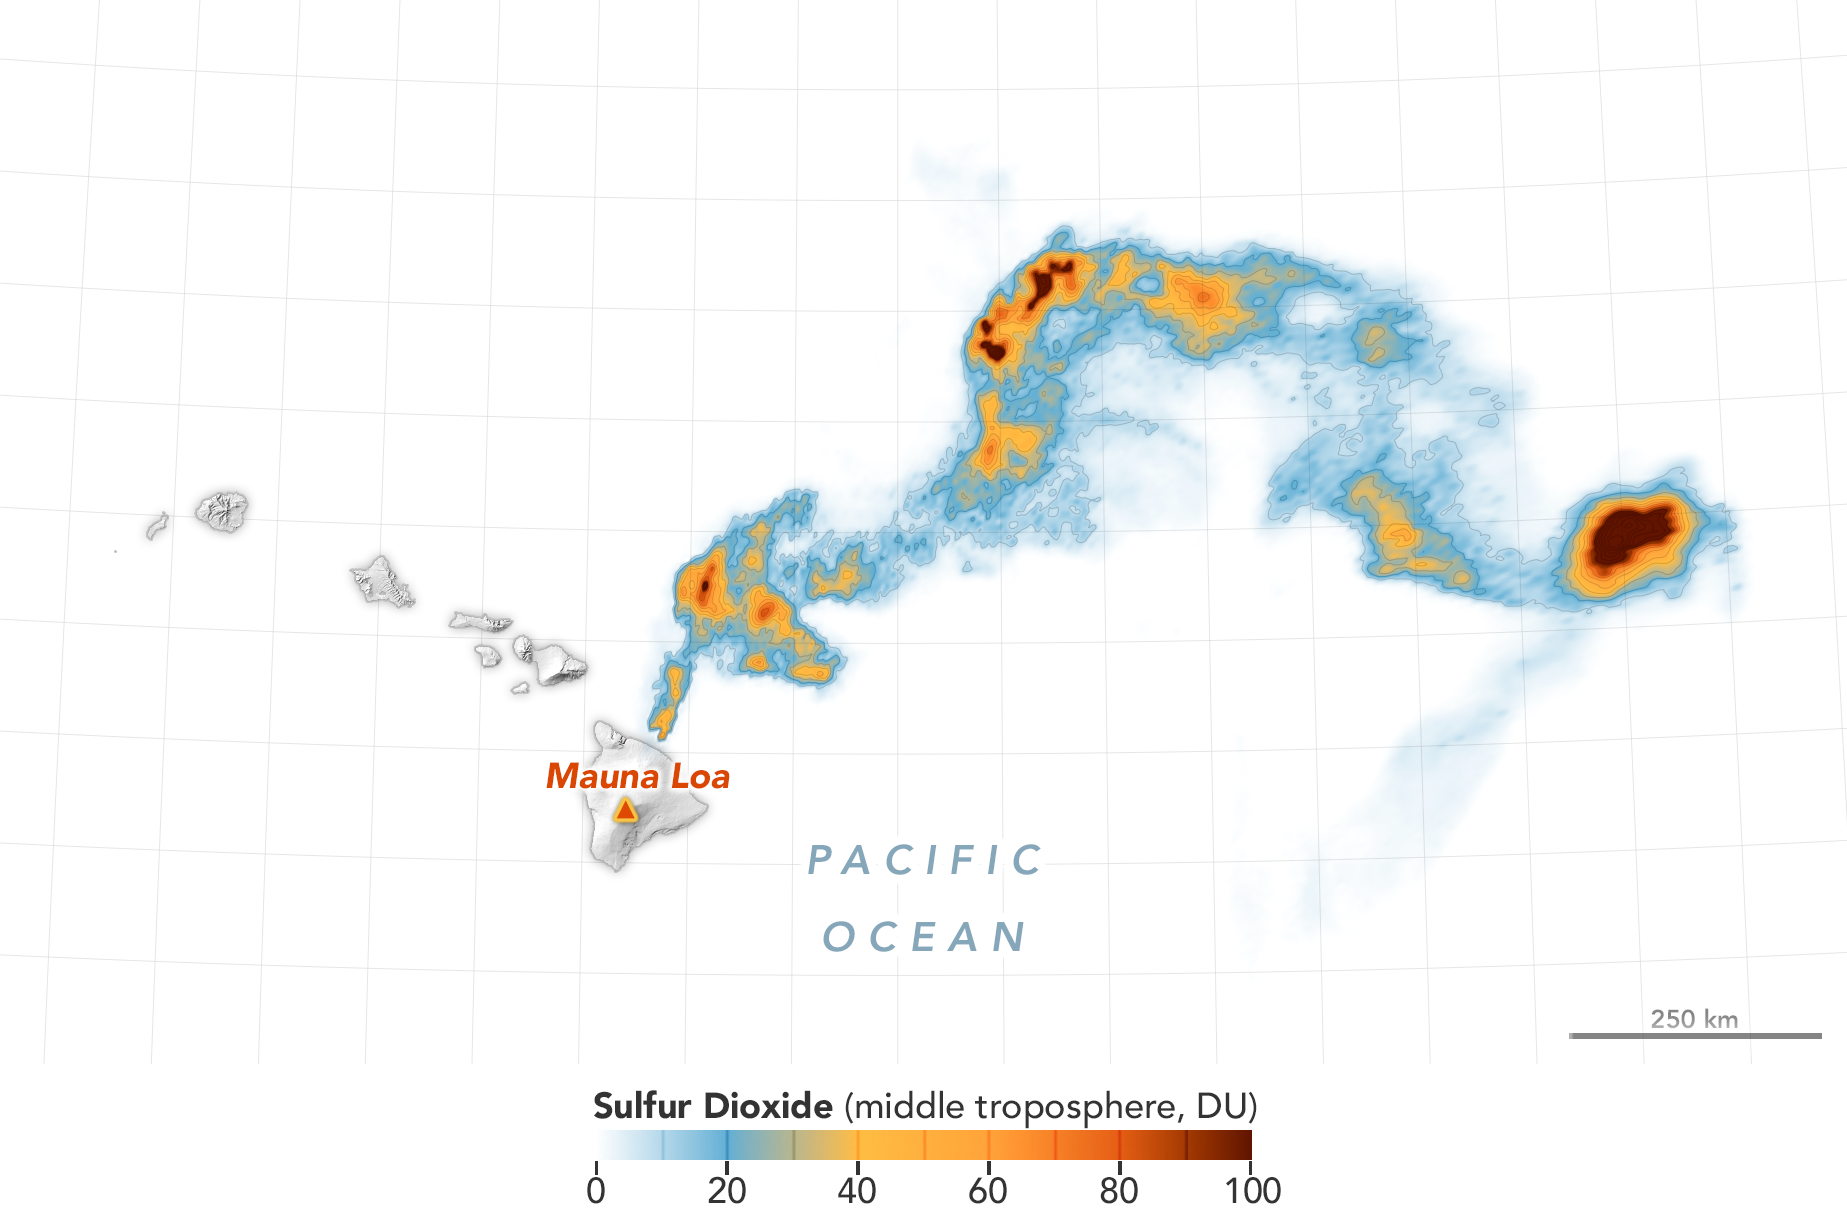
The Earth Observatory legend ends at 100 DU. Separately, the NASA GSFC scientific plot for 28 November prints a maximum of 184.30 DU at 23:43 UTC. That header value exceeds 100 by 84.30 DU. It is a value reported on the scientific retrieval plot, not a number we recovered from the colors in the Earth Observatory map.
A color scale stopping at 100 therefore does not, by itself, establish that the sensor stops measuring at 100. It tells us where that display legend ends. Diagnosing detector saturation requires instrument or product-quality evidence, rather than the appearance of the last color.
There is an important limit to the comparison: the two SO₂ figures have not been matched at the source-granule and algorithm level. We cannot use the scientific plot’s maximum to assign an exact value to a particular pixel in the Earth Observatory artwork. The differing filename date noted in the caption is preserved rather than silently repaired.
The nighttime glow and the gas observation are eleven hours apart
The scientific plot identifies orbit 26567 and an observation interval of 23:42–23:45 UT on 28 November. Relative to the DNB image at 12:25 UTC, that is a gap of 677–680 minutes, or 11 hours 17–20 minutes.
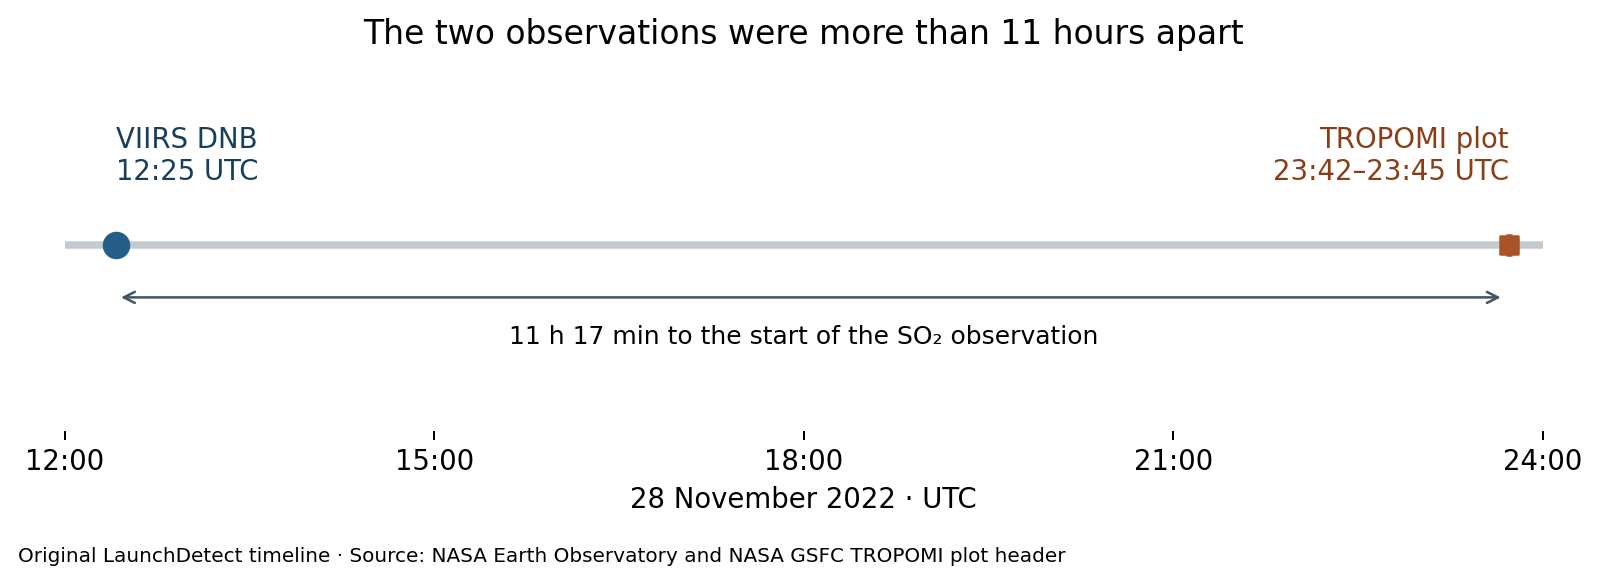
This rules out treating those two observations as a synchronized map of glow and gas. The interval leaves time for the eruption and atmosphere to evolve. Without a matched transport analysis, an offset between a bright nighttime patch and a later gas plume cannot be reduced to a sensor-registration error or used as a measured plume speed.
| Item | What the source provides | What it does not establish |
|---|---|---|
| VIIRS nighttime image | 28 Nov 2022, 12:25 UTC; visible low-light signal | Ground lava area or an SO₂ column |
| Earth Observatory SO₂ artwork | Page date 28 Nov 2022; middle-troposphere legend 0–100 DU | A 100-DU detector saturation limit |
| Separate scientific TROPOMI plot | Orbit 26567; 23:42–23:45 UT; maximum 184.30 DU at 23:43 UTC | Identical processing to the Earth Observatory artwork |
| Our time subtraction | 677–680 minutes between DNB and scientific-plot interval | A simultaneous observation of the two signals |
What this pair can answer
The nighttime image helps illustrate an intensely luminous eruption and a reported detector-recovery artifact. The SO₂ map shows the spatial pattern of a retrieved gas column. The printed scientific header supplies a separately documented time window and maximum. Together they reveal why a familiar visual cue, an extreme pixel or color, can have different meanings in different products.
They do not supply ground-level SO₂ exposure, ash concentration, a lava-flow area or an eruption emission rate. Even a total mass printed on a retrieval plot would need its own footprint, altitude and processing assumptions before becoming a different kind of quantity. This historical comparison offers no current volcanic or aviation guidance.
For another multi-instrument event, start with this concrete reading order: identify the measured quantity, read the unit and display range, record the acquisition time, then inspect the source’s explanation of any artifact. Only after those steps should matching colors or shapes become evidence for a shared physical interpretation.
The two-row observation-time CSV contains the times used for our subtraction. Timeline and calculations are original LaunchDetect work. NASA imagery is reproduced with the credits above under NASA’s media guidance; the separate scientific plot is linked as evidence and is not republished here. Sources were checked on 4 October 2026.