Launch Watch · Earth
Published
Why the warmest Niño region had the smallest anomaly in November 2015
Niño 4 was warmer than Niño 3.4 but less anomalous. Reproduce four weeks of NOAA SST data and see how regional baselines reverse the ranking.
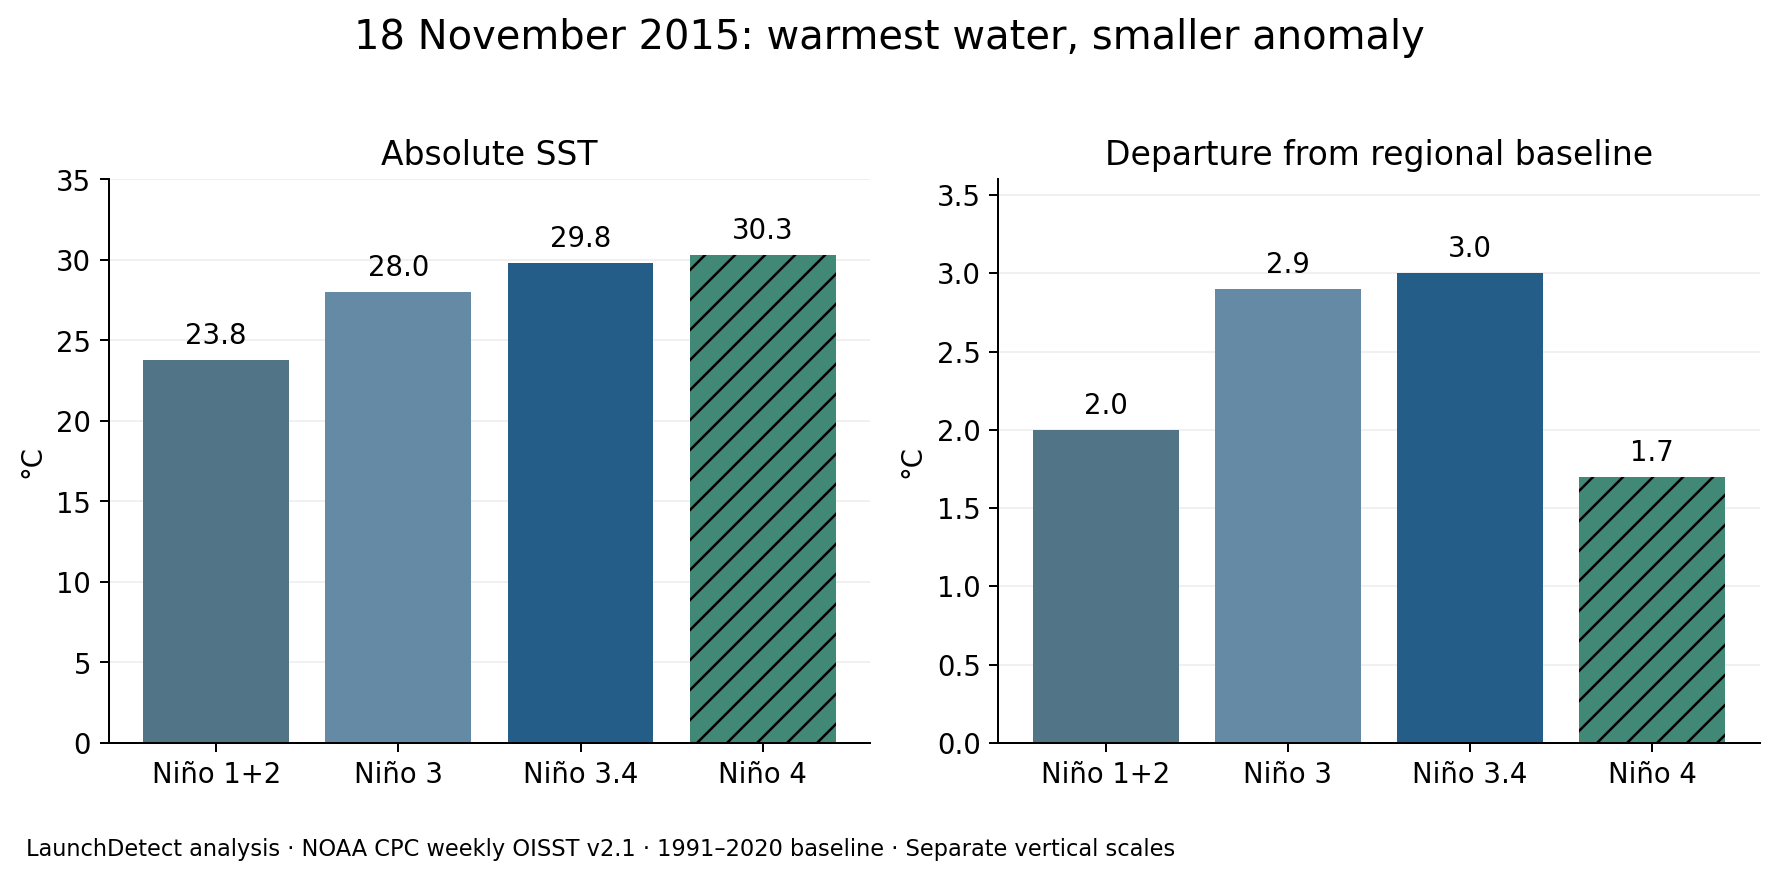
The warmest of NOAA’s four Niño regions in the week centered on 18 November 2015 had the smallest temperature anomaly. Niño 4 averaged 30.3°C, but its departure from the regional baseline was +1.7°C. Niño 3.4 was cooler at 29.8°C and had a larger anomaly of +3.0°C.
That is a real ranking reversal in NOAA CPC’s weekly sea-surface-temperature file. It explains why the reddest region on an anomaly map need not contain the warmest water: each regional temperature is being compared with its own expected value.
Reconstruct the comparison
| Region | Absolute SST | SST anomaly | Implied weekly climatology |
|---|---|---|---|
| Niño 1+2 | 23.8 | +2.0 | ≈21.8 |
| Niño 3 | 28.0 | +2.9 | ≈25.1 |
| Niño 3.4 | 29.8 | +3.0 | ≈26.8 |
| Niño 4 | 30.3 | +1.7 | ≈28.6 |
Niño 4 is 30.3 − 29.8 = 0.5°C warmer than Niño 3.4. Its anomaly is 1.7 − 3.0 = 1.3°C smaller. Neither statement contradicts the other. Absolute SST answers how warm the water is; anomaly answers how far it departs from the climatology used by this product.
Subtracting anomaly from SST makes that regional reference visible. For Niño 4, 30.3 − 1.7 gives an implied climatological temperature of approximately 28.6°C. For Niño 3.4, 29.8 − 3.0 gives approximately 26.8°C. The implied baselines differ by about 1.8°C, enough to reverse the ranking after subtraction.
These reconstructed climatologies are arithmetic from the displayed values. They are approximate because both input columns are rounded to 0.1°C. We have not retrieved the unrounded climatology grids or gained extra physical precision by subtracting rounded numbers.
Does the reversal depend on picking one week?
For each of the four November 2015 weekly rows, we compared the highest SST with the smallest anomaly across the four regions. Niño 4 occupies both positions in every row. On 4 November its values are 30.1°C and +1.4°C; on 25 November they are 30.3°C and +1.7°C.
The region with the largest anomaly varies: Niño 3 leads on 4 November; Niño 3.4 leads on 11 and 18 November; Niño 3 and Niño 3.4 tie on 25 November. The central result survives all four rows without implying that one region must always be the most anomalous.
Inspect all four November weeks and 16 region-week values
All values are from the frozen CPC file accessed on 4 October 2026. Implied climatology is SST minus anomaly, using the rounded source columns.
| Week centered | Region | SST | Anomaly | Implied climatology |
|---|---|---|---|---|
| 2015-11-04 | Niño 1+2 | 23.6 | +2.2 | 21.4 |
| 2015-11-04 | Niño 3 | 27.7 | +2.7 | 25.0 |
| 2015-11-04 | Niño 3.4 | 29.4 | +2.6 | 26.8 |
| 2015-11-04 | Niño 4 | 30.1 | +1.4 | 28.7 |
| 2015-11-11 | Niño 1+2 | 23.6 | +2.0 | 21.6 |
| 2015-11-11 | Niño 3 | 27.8 | +2.7 | 25.1 |
| 2015-11-11 | Niño 3.4 | 29.5 | +2.8 | 26.7 |
| 2015-11-11 | Niño 4 | 30.2 | +1.6 | 28.6 |
| 2015-11-18 | Niño 1+2 | 23.8 | +2.0 | 21.8 |
| 2015-11-18 | Niño 3 | 28.0 | +2.9 | 25.1 |
| 2015-11-18 | Niño 3.4 | 29.8 | +3.0 | 26.8 |
| 2015-11-18 | Niño 4 | 30.3 | +1.7 | 28.6 |
| 2015-11-25 | Niño 1+2 | 24.1 | +2.1 | 22.0 |
| 2015-11-25 | Niño 3 | 28.0 | +2.9 | 25.1 |
| 2015-11-25 | Niño 3.4 | 29.6 | +2.9 | 26.7 |
| 2015-11-25 | Niño 4 | 30.3 | +1.7 | 28.6 |
Know which regions and which baseline you are comparing
The CPC index page identifies this series as weekly OISST v2.1 with a 1991–2020 base period. Its region definitions are below. Niño 4 spans the date line; the longitude labels describe a Pacific region rather than a box extending through the rest of the world.
| Region | Latitude | Longitude |
|---|---|---|
| Niño 1+2 | 0–10°S | 90–80°W |
| Niño 3 | 5°N–5°S | 150–90°W |
| Niño 3.4 | 5°N–5°S | 170–120°W |
| Niño 4 | 5°N–5°S | 160°E–150°W |
The regions differ in size and overlap. Treating the four regional means as independent measurements, or adding them together into a larger Pacific temperature, would not be supported by this table. Our comparison is a ranking of named regional averages in the same weekly product.
The baseline is especially important for historical examples. We use the 1991–2020-baseline file accessed in 2026. This is not a preserved copy of the exact numbers a forecaster would have downloaded in November 2015. A comparison with an older news graphic should first check that graphic’s product and reference period.
Satellite-informed SST is an analysis, not a single photograph
NOAA’s OISST documentation describes an analysis that combines satellite and in-situ observations and fills sampling gaps on a regular grid. The regional averages here inherit that product’s processing. They are not readings from four individual satellite pixels.
This matters when pairing the table with a colorful image. A different SST product can have different observations, spatial detail, averaging and baseline. For example, NASA’s November 2015 El Niño illustration uses MUR SST context. It does not supply the CPC numbers in this article. We use an original chart of the actual table values so the visual and arithmetic refer to the same product.
Nor are these weekly SST anomalies the Oceanic Niño Index. ONI is a separate three-month index series listed by CPC, and relative indices are separate again. A weekly Niño 3.4 anomaly of +3.0°C should not be relabeled as a monthly value or an ONI observation.
Use the metric that answers your question
If the question is “Which of these regions was warmest?”, use the absolute SST column: Niño 4. If the question is “Which departed furthest above its baseline that week?”, use the anomaly column: Niño 3.4 for 18 November. Retain the week-centered date, region and baseline whenever you quote either answer.
To reproduce the analysis, select the four NOV2015 rows from the linked CPC file, read each region’s SST and SSTA pair, then subtract SSTA from SST. The downloaded CSV supplies all 16 pairs and derived values without requiring scripts or an interactive chart. This is a historical explanation of two measures, not a new El Niño classification or a forecast.
Source and credit: NOAA Climate Prediction Center, weekly OISST v2.1, 1991–2020 baseline, accessed 4 October 2026. Calculations and graphics are original LaunchDetect work using credited government data under the National Weather Service disclaimer; they are not official NOAA graphics.