Launch Watch · launch_schedule_precision
Published
PACE launch weather: compare forecasts for the same target day
Four NASA PACE forecasts show why issue dates and launch dates belong on separate axes, and why the comparable revision is 60% to 50%.
PACE’s launch-weather headlines went from 40% to 50% to 95% in February 2024. Reading those numbers as three updates to one launch opportunity loses the most important field: the date each forecast covered. The clean comparison in this small record is 60% to 50%, both for February 7.
This worked example keeps the forecast’s issue date separate from its target launch date. It uses four values reported by NASA, then shows how to choose the pair that can fairly be compared.
Put the launch day on a second axis
NASA’s February 5 weather report contained two forecasts: 40% favorable for February 6, and 60% for the next opportunity on February 7. The February 6 report gave 50% for February 7. The February 7 report gave 95% for February 8.
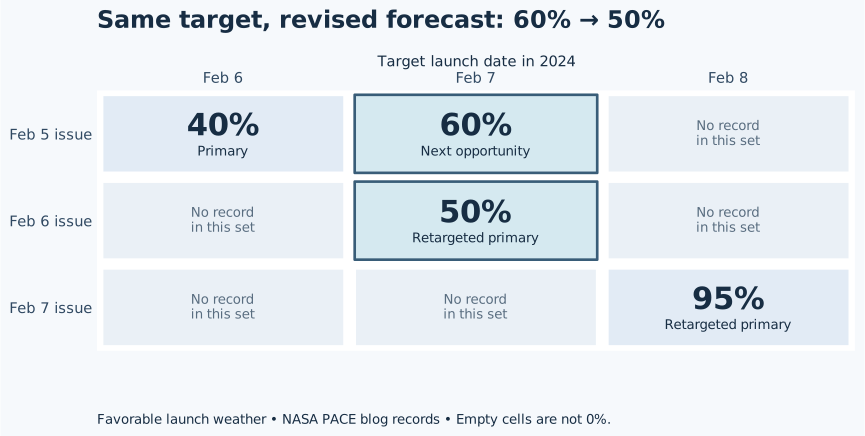
The two entries in the February 7 column belong together. A row-wise reading instead follows a sequence of issue dates while the proposed launch day also moves. Both views can be useful, but they answer different questions.
| Report date | Target launch date | Reported target time | Favorable weather | Opportunity in that report |
|---|---|---|---|---|
| Feb 5, 2024 | Feb 6, 2024 | 1:33 a.m. EST | 40% | Primary |
| Feb 5, 2024 | Feb 7, 2024 | Not separately stated | 60% | Next available opportunity |
| Feb 6, 2024 | Feb 7, 2024 | 1:33 a.m. EST | 50% | Retargeted primary |
| Feb 7, 2024 | Feb 8, 2024 | 1:33 a.m. EST | 95% | Retargeted primary |
The defensible change is 10 percentage points
Select the two rows whose target date is February 7. Order them by report date. Subtract the earlier value from the later one: 50 minus 60 equals −10 percentage points. That is a downward revision in the reported chance of favorable weather for the same target day.
The word “points” matters. It names the difference on the 0–100 percentage scale. Reporting a 10% decrease would normally imply a relative calculation with the original 60% as its denominator. There is no need for that extra calculation to communicate this revision.
Try it: can 40% and 95% establish a same-day improvement?
No. In these records, 40% covers February 6 and 95% covers February 8. Their 55-point numerical difference spans different target days. To measure a revision for February 8, first find an earlier forecast explicitly valid for February 8; this four-record set does not contain one.
The absence of a row is useful information. Filling the blank with the previous day’s number would turn a missing forecast into an invented one. Joining every visible percentage with a continuous line would make that invention much harder for a reader to spot.
Keep the stand-down explanation beside the forecast
A separate NASA update dated February 6 said the February 7 launch would not proceed because ground winds prevented prelaunch checkouts. That statement identifies an operational problem before the target liftoff time. It adds context that the percentage alone cannot carry.
A forecast row and a stand-down row therefore need different fields. The forecast has an issue date, a target opportunity and a favorability value. The stand-down has an affected opportunity, an announced reason and a replacement target. Combining the records is helpful; reducing both to a single “launch chance” number is not.
These percentages concern favorable launch weather as reported by the launch-weather team. They do not describe every condition needed for a successful mission. Hardware readiness, range availability and the later flight sequence are outside this numerical comparison. This case also provides neither pad wind telemetry nor a collection of outcomes large enough to assess forecast skill.
A practical way to read the next update
- Copy the valid opportunity first. Keep the launch date and any explicitly stated time together.
- Keep the report date in its own field. A newer article can describe a different launch day.
- Retain primary or backup status. The February 7 opportunity changes status in these reports, while its date stays recognizable.
- Compare only matched targets. If the target changes, start another column instead of silently continuing the first series.
For this PACE record, the resulting takeaway is specific: the reported February 7 favorability fell from 60% to 50%. The later 95% forecast belongs to February 8. Keeping those two dates in view makes the headline sequence understandable without pretending it is one continuously improving forecast.