Reading the evidence · Guide
What a satellite thermal signal says about a launch
Published
A weather satellite can record a thermal change consistent with a rocket launch. Interpreting that change takes the source imagery, acquisition times and surrounding scene. One bright pixel cannot establish the mission, exact liftoff time, exhaust temperature or flight path.
Imagine pausing a satellite animation just as a bright patch appears near a spaceport. The tempting question is, “Which rocket is that?” Start one step earlier: what changed in the measurement, and what could explain it?
That question is the foundation of useful launch evidence. Here is how to read the signal before turning it into a claim.
What does a thermal satellite image measure?
The Advanced Baseline Imager, or ABI, on NOAA’s GOES weather satellites measures radiation in distinct spectral bands. In an infrared band, the calibrated quantity is radiance: radiation arriving at the instrument from a particular direction and wavelength range.
For ABI’s emissive channels (Bands 7–16), NOAA’s Cloud and Moisture Imagery product expresses this as top-of-atmosphere brightness temperature in kelvin. Brightness temperature is the temperature an ideal blackbody would need to produce the measured radiance for that band. It is a way to express the radiation measurement, not a thermometer placed in the rocket’s exhaust.
The colors come later. A display maps values to a chosen palette. Red can mean a higher value in one image and something different in another. A cropped screenshot without its band, units and color scale cannot tell you how hot a source was.
Why can a rocket launch stand out?
ABI Band 7 is centered near 3.9 micrometers. NOAA’s Band 7 guide explains why it is useful for detecting hot spots: this shortwave-infrared band is especially sensitive to the hottest portion of a pixel compared with longer-wave infrared channels. That sensitivity helps explain how a launch-related hot source can become conspicuous against its surroundings.
A pixel can contain contributions from a small hot source and a much larger, cooler background. The combined radiance does not translate into a simple average of their physical temperatures. NOAA’s fire-detection algorithm documentation describes the underlying sub-pixel physics. The principle helps explain visibility; it does not make a fire algorithm a validated rocket-launch detector.
Band 7 has a nominal spatial resolution of 2 kilometers at nadir, directly beneath the satellite, according to NOAA’s ABI documentation. A smaller source may affect the measurement without being resolved as an object. A highlighted pixel therefore does not mean the rocket or plume is 2 kilometers wide.
Daylight adds another complication. At 3.9 micrometers, reflected sunlight can contribute substantially alongside emitted radiation. Cloud properties and illumination can change a pixel’s appearance. A brighter daytime patch is not automatically a hotter object.
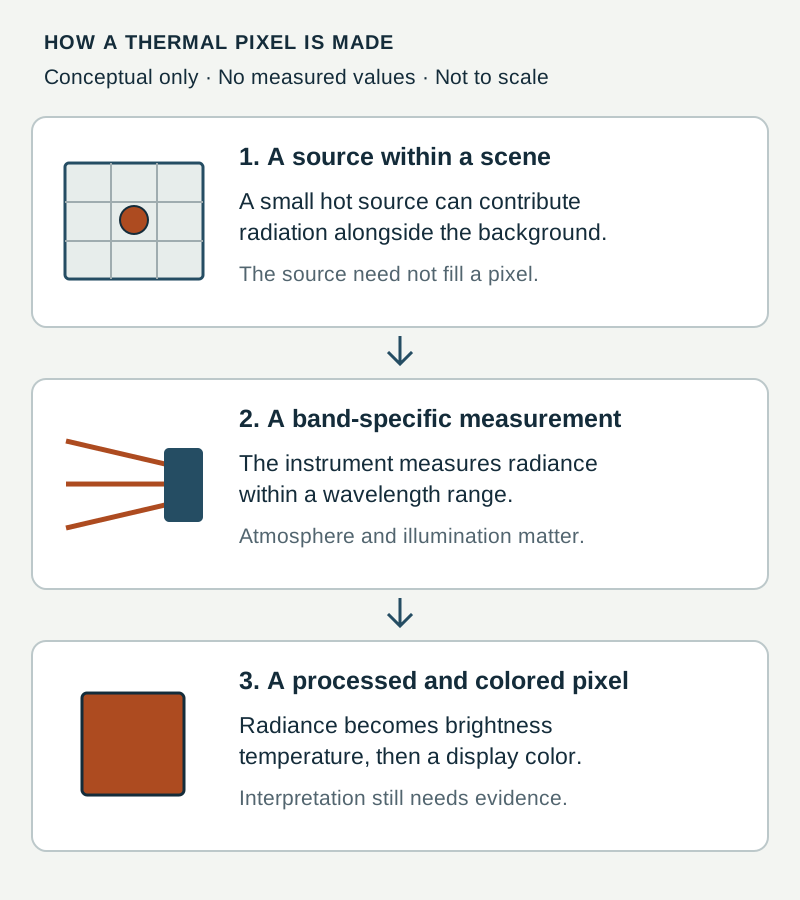
Open the conceptual diagram at full size
A real example to read alongside the explanation
NASA’s Artemis I launch provides a public, source-linked example. NASA reported that SLS lifted off from Kennedy Space Center’s Pad 39B on November 16, 2022, at 1:47 a.m. EST, or 06:47 UTC. That establishes the event and the time precision given in the release.
In a separate CIMSS analysis of the satellite signatures, Scott Bachmeier described GOES-16 imagery at 30-second intervals, made possible by overlapping one-minute mesoscale sectors. The analysis distinguished a rapidly northeastward-moving booster signature from a low-altitude condensation cloud drifting more slowly eastward.
Open the linked sequence and follow those two features separately. Ask which bands show each feature, how it changes between frames, and where the source’s interpretation begins. Motion and multi-band context add information that a single bright patch cannot supply.
This is a reading example based on NASA’s report and CIMSS’s published analysis. It is not a new measurement of the imagery or a validation of LaunchDetect’s performance. The historical example used GOES-16; NOAA currently identifies GOES-19 as GOES East and GOES-18 as GOES West.
Check what else could explain the change
Before attributing a candidate signal to a launch, work through the surrounding evidence:
- Compare earlier and later images. Was the feature already present? Does it remain fixed, move or disappear? Keep the band and display scale consistent.
- Inspect the background and other bands. Consider persistent hot spots, cloud changes and reflected sunlight. NOAA’s hot-spot methodology illustrates why contextual checks, atmospheric effects and false-alarm screening matter.
- Read the source metadata. Record the satellite, instrument, band, product, source file and acquisition interval. Check quality flags and missing or out-of-range data before treating a value as usable.
- Keep image coordinates and event locations separate. A launch-site marker is contextual information. It is not a measurement of the plume’s position or a reconstructed three-dimensional trajectory.
Timing needs the same care. An observation time, scheduled launch time and publication time describe different events. Subtracting an observation timestamp from a launch label does not establish how quickly a public alert was delivered.
Choose a claim the evidence can support
Use this checklist when describing a thermal launch signature. Each row starts with an observation and keeps the interpretation conditional.
| Observed change | Possible interpretation | Corroboration to seek | Still unresolved |
|---|---|---|---|
| A localized change in valid infrared data | A transient source may be contributing radiation | Earlier and later frames, other bands, background and quality checks | Its identity, physical size and temperature |
| A feature changes position across images | The pattern may be consistent with a moving launch-related source | Image timing, viewing geometry and an independent event report | A precise three-dimensional path |
| The image time and region align with a reported launch | The signal may be associated with that event | A primary account of the completed launch and traceable imagery | Whether every visible feature has the same cause |
A missing signature also needs a bounded interpretation. Cloud, viewing geometry, scan timing, source strength and unavailable data can limit what is visible. An image with no clear launch-related feature does not prove that no launch occurred.
Inspect a public evidence record
Try the same distinction on LaunchDetect’s USSF-385 evidence page. This is a separate government mission, not the Artemis I example above. The page distinguishes observed imagery from modeled object paths and areas. Read those labels before treating an overlay as a measurement.
For application developers, the free detection API guide explains how to retrieve published summaries and link back to their evidence pages. The API does not return raw sensor imagery, and its recent feed is not a complete census of worldwide launches.
A useful thermal claim tells a reader what was observed, why a launch is a plausible interpretation, and which questions remain open. Keep all three visible.